

Introduction and Accessing Data
For my miniproject, I chose the title “Probability of a Blackout in Kenya”. I chose this title especially because my motivation to pursue electrical engineering was inspired by rampant blackouts and power rationing in Kenya in the 2010s. Moreover, an eerie experience on the 10th of December 2023, when a nationwide blackout occurred, has recently given me hope that I can have a positive impact in the sector. It was two months after I had completed my final master's exams, and the undergraduates were having their 1st day of exams on the next day. The blackout occurred at 8 pm and lasted to about 3 pm the next day. I empathised with my fellow students as I felt that the entire experience was an ordeal that the students shouldn’t have had to go through, examinations are already tough. The experience unfortunately isn’t new in Kenya or in many developing countries. Kenya has experienced 7 nationwide blackouts between January 2023 and December 2024, much of this due to the unreliability of wind and solar energy during peak demand which, unlike many other energy sources, can’t be ramped up during peak usage unless energy storage systems are used. Moreover, in Kenya, only 50.4% of households are connected to electricity. So I forged on with the mini-project, basing my work on the fynesse framework. The 1st part of the fynesse framework is data acquisition, typically the hardest part of any data science project. I located the sources of my would-be datasets and converted them to csv format. Specifically, I located 4 sources:
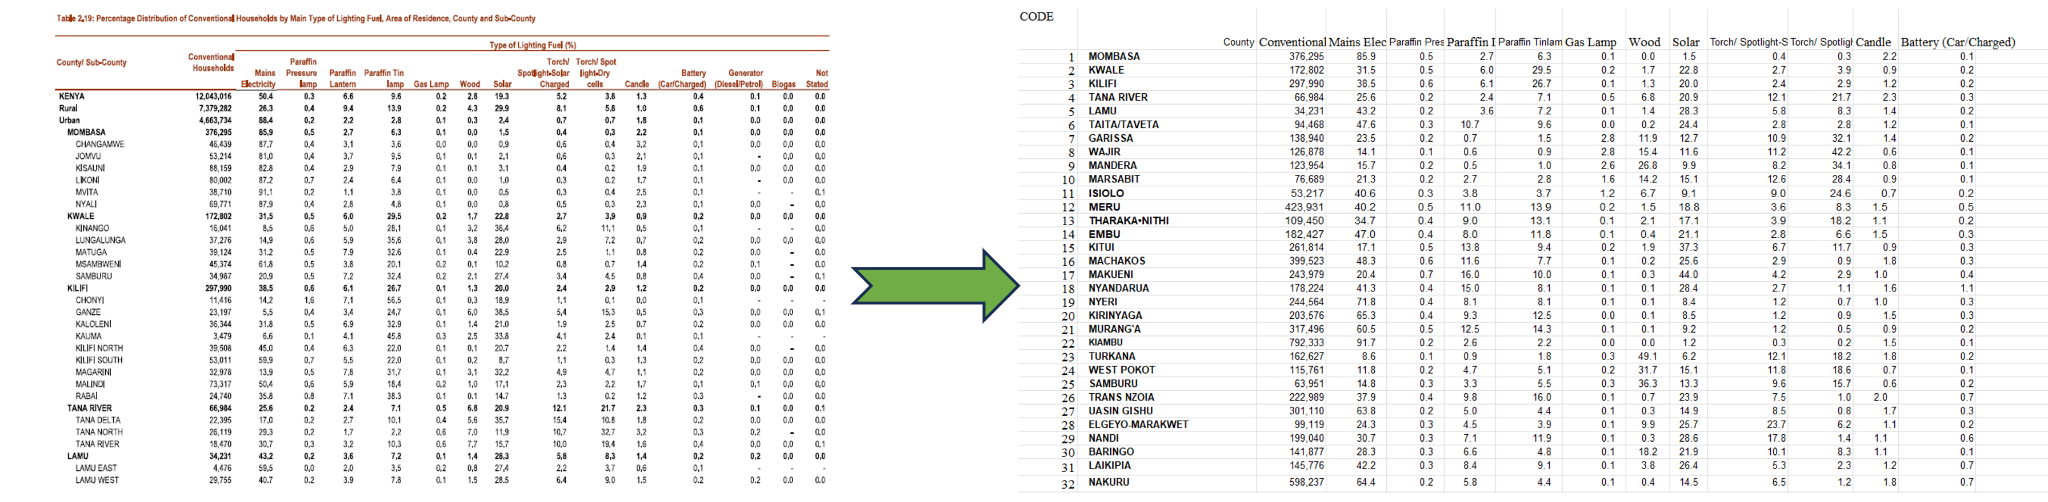
1. Percentage of households that use mains electricity from the Kenya 2019 Household type of Lighting Fuel (%) Census Data (pages 338-349). The challenge there was how to access that data in non-pdf format, the Kenya National Bureau of Statistics (KNBS) does have a data portal for some of the census data but not for my target data which was type of Lighting Fuel, also one can request data from KNBS via email datarequest@knbs.or.ke. Being aware of bureaucratic processes, I chose to extract directly from the pdf, as a programmer, I also saw this as an interesting challenge. I took the entire 500-page pdf and snipped pages 338 to 349. I then converted that data to Excel using online tools. From there, I conducted manual cleaning. I was interested in per-county data, but subcounty data is also available here. I merged this data with population and census data that was made available to me by my colleague, Samuel Mbatia Gachana. I also added a Kenyan county code column and later ISO-3166-2:KE county codes to make sure merging the data with geospatial data from Open Street Maps was seamless, merging based on names caused several errors within the notebook. I was a little annoyed that the ISO-3166-2:KE codes differed from the Kenyan County Codes, for example, Nyeri County is county number 19, but its ISO code is KE-36. This initially affected how I could plot data in the maps, but I was able to reconcile the work. This part of the access work is illustrated below.
2. Reliability Index data, that is CAIDI, SAIDI and SAIFI from 2023 to the present. This data I obtained from EPRA reports 2023/24 and 2024/25. This data was more about manually inputting the index data with its respective year and month. This data was only available for the entire nation, not per county.
3. Open Street Maps of Kenya and Kenyan Counties. I used osmnx (the Python module for OpenStreet Maps access) to plot my maps, but I found that calling the API would take about 50 minutes. So to ease my work, I downloaded the maps. The function I use can load from a downloaded map as well as from osmnx, thus, when going through the notebook, it will be quite easy for anyone to use it.
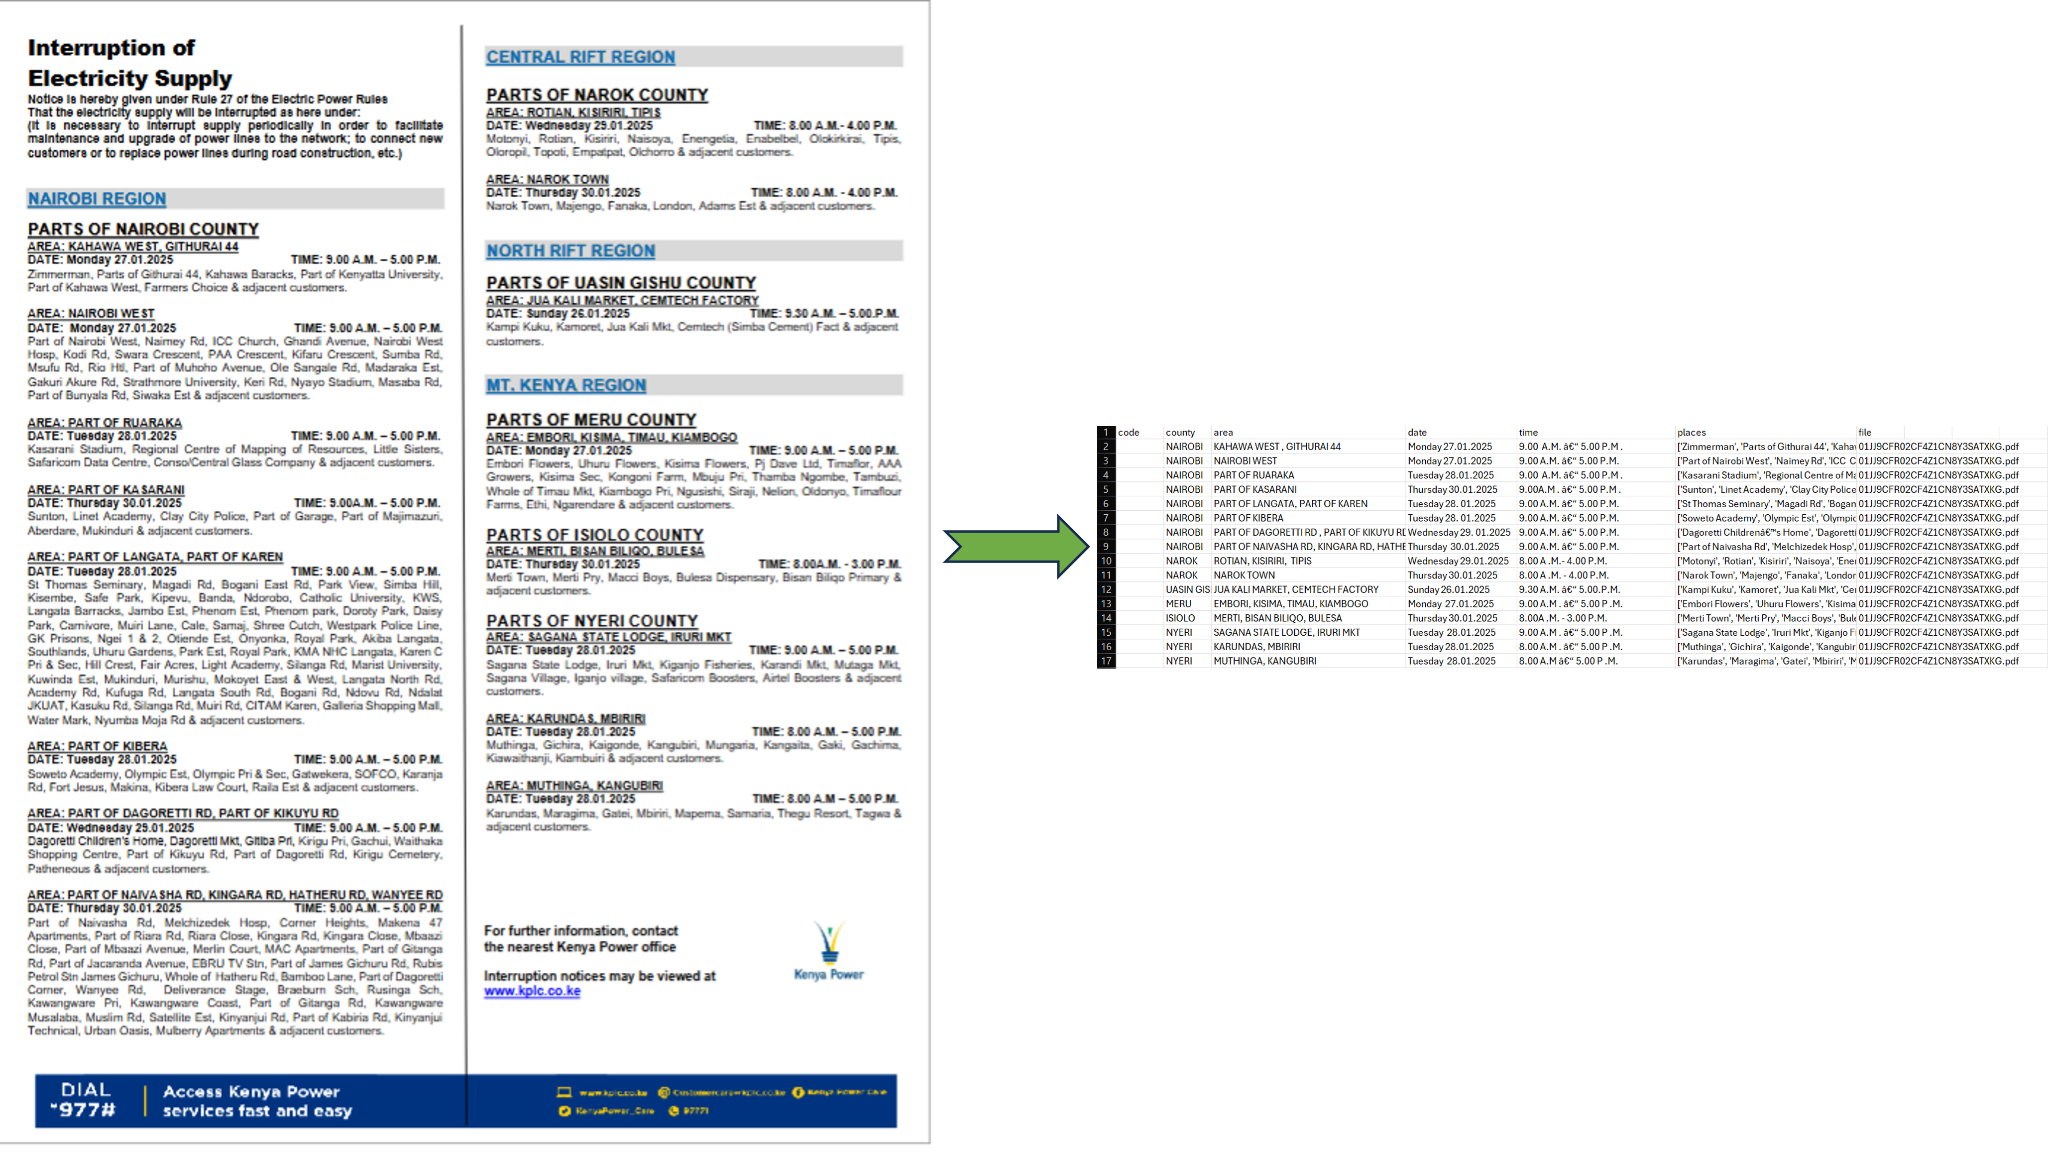
4. Lastly, I obtained data from Kenya Power (KPLC) of all notices available. Initially, I had tried to scrape from X.com (twitter.com), but scraping from the KPLC website was a logical and better option. The notices are in pdf format. I used the BeautifulSoup module to scrape the pdfs from the KPLC Interruptions notice webpage, obtaining about 55 notices and 6 reports. Using the PyPDF2 module, the text in the PDFs was extracted and using regex code, I obtained the county, area, date, start and end time and places affected. This resulted in the 55 notices being part of one csv document. The figure below shows a sample pdf and accompanying csv section for that pdf page. Ideally, I should have found a way to link conventional households to the affected places, but instead, I chose for the moment to use per-county data. Unfortunately, based on time and lack of merging data, I proceeded to analysis, data quality checking and date formatting. As in the census data, I added the county codes for merging purposes. I would group this data on a per-county and monthly basis.
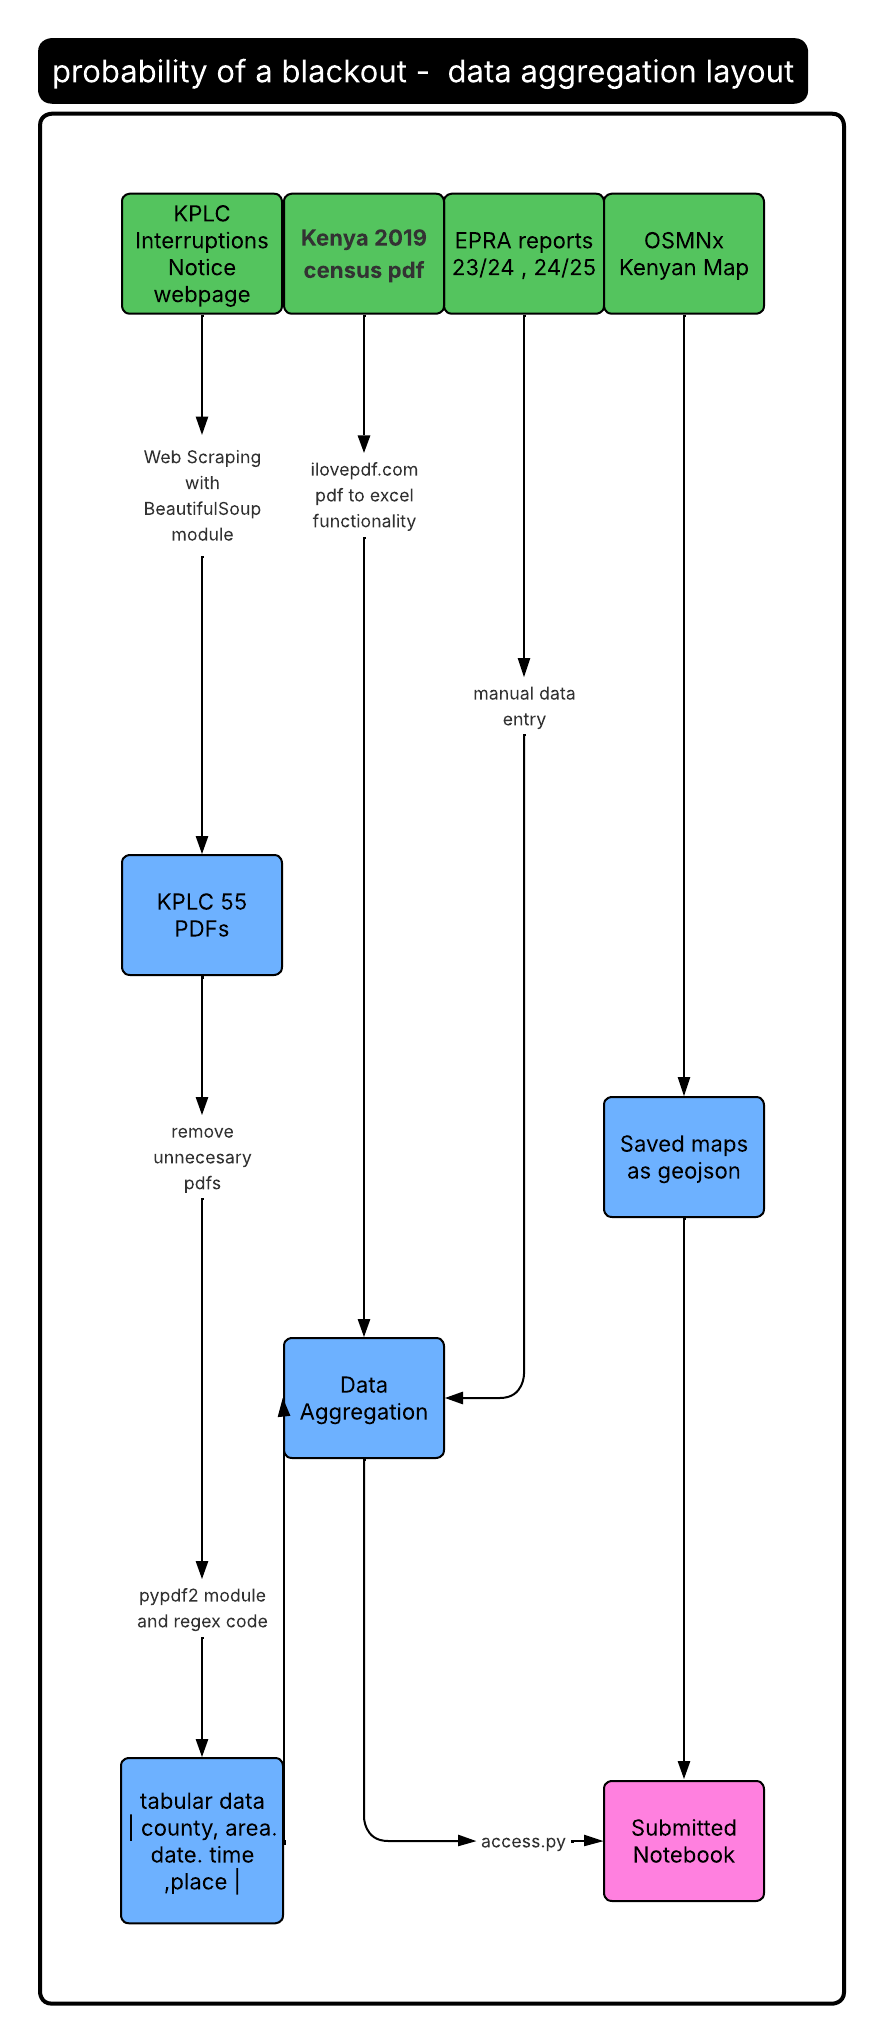
This was the end of the access portion of my mini-project. A flowchart summary is presented below.
Data Analysis
From here, I proceeded on to assess and address. These sections respectively represent the data quality checks and answering questions. Before I explain my address and assessment, I believe the context of Kenya and Kenya’s energy sector would be useful to you. Kenya had a largely centralised government from 1963 to 2010, the counties that I mention started to exist from 2010 onwards. A large portion of the Kenyan economy is centralised around Nairobi, the political and financial capital, Mombasa, the location of Kenya’s main port and gateway to East and Central Africa and Kisumu, the gateway to Lake Victoria. Kenya’s electricity sector has approximately 81% of the electrical energy used coming from clean sources such as geothermal, hydro, wind and solar, 8% of the electrical energy coming from fossil fuel-based generation for maintaining voltage stability during peak demand and 11% from imports mainly from Ethiopia (likely from the Grand Ethiopian Renaissance hydropower Dam(GERD)). As mentioned earlier, having climate-friendly, renewable energy generation has its downsides. Between March and December 2023, Kenya experienced four nationwide blackouts on March 4th, August 25th, November 11th and December 10th caused by system disturbances, transmission failure and the sudden loss of generation from the Lake Turkana Wind Power Plant. In 2024, nationwide and near-nationwide blackouts were recorded on May 2nd, September 6th and December 18th, showing the fragility of the grid’s transmission and balancing capacity. No such blackouts have been recorded in 2025 (as of October), suggesting signs of an improvement in operational control and thus grid resilience.
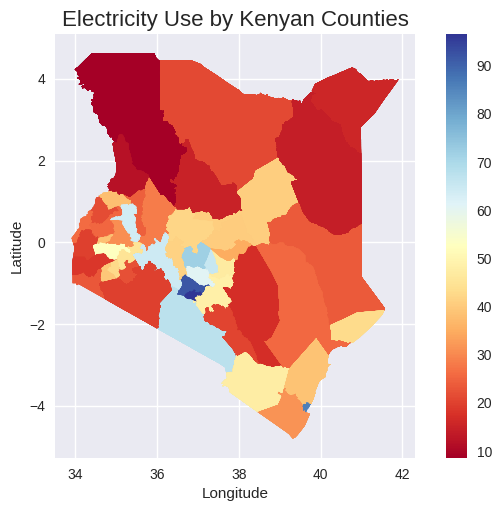
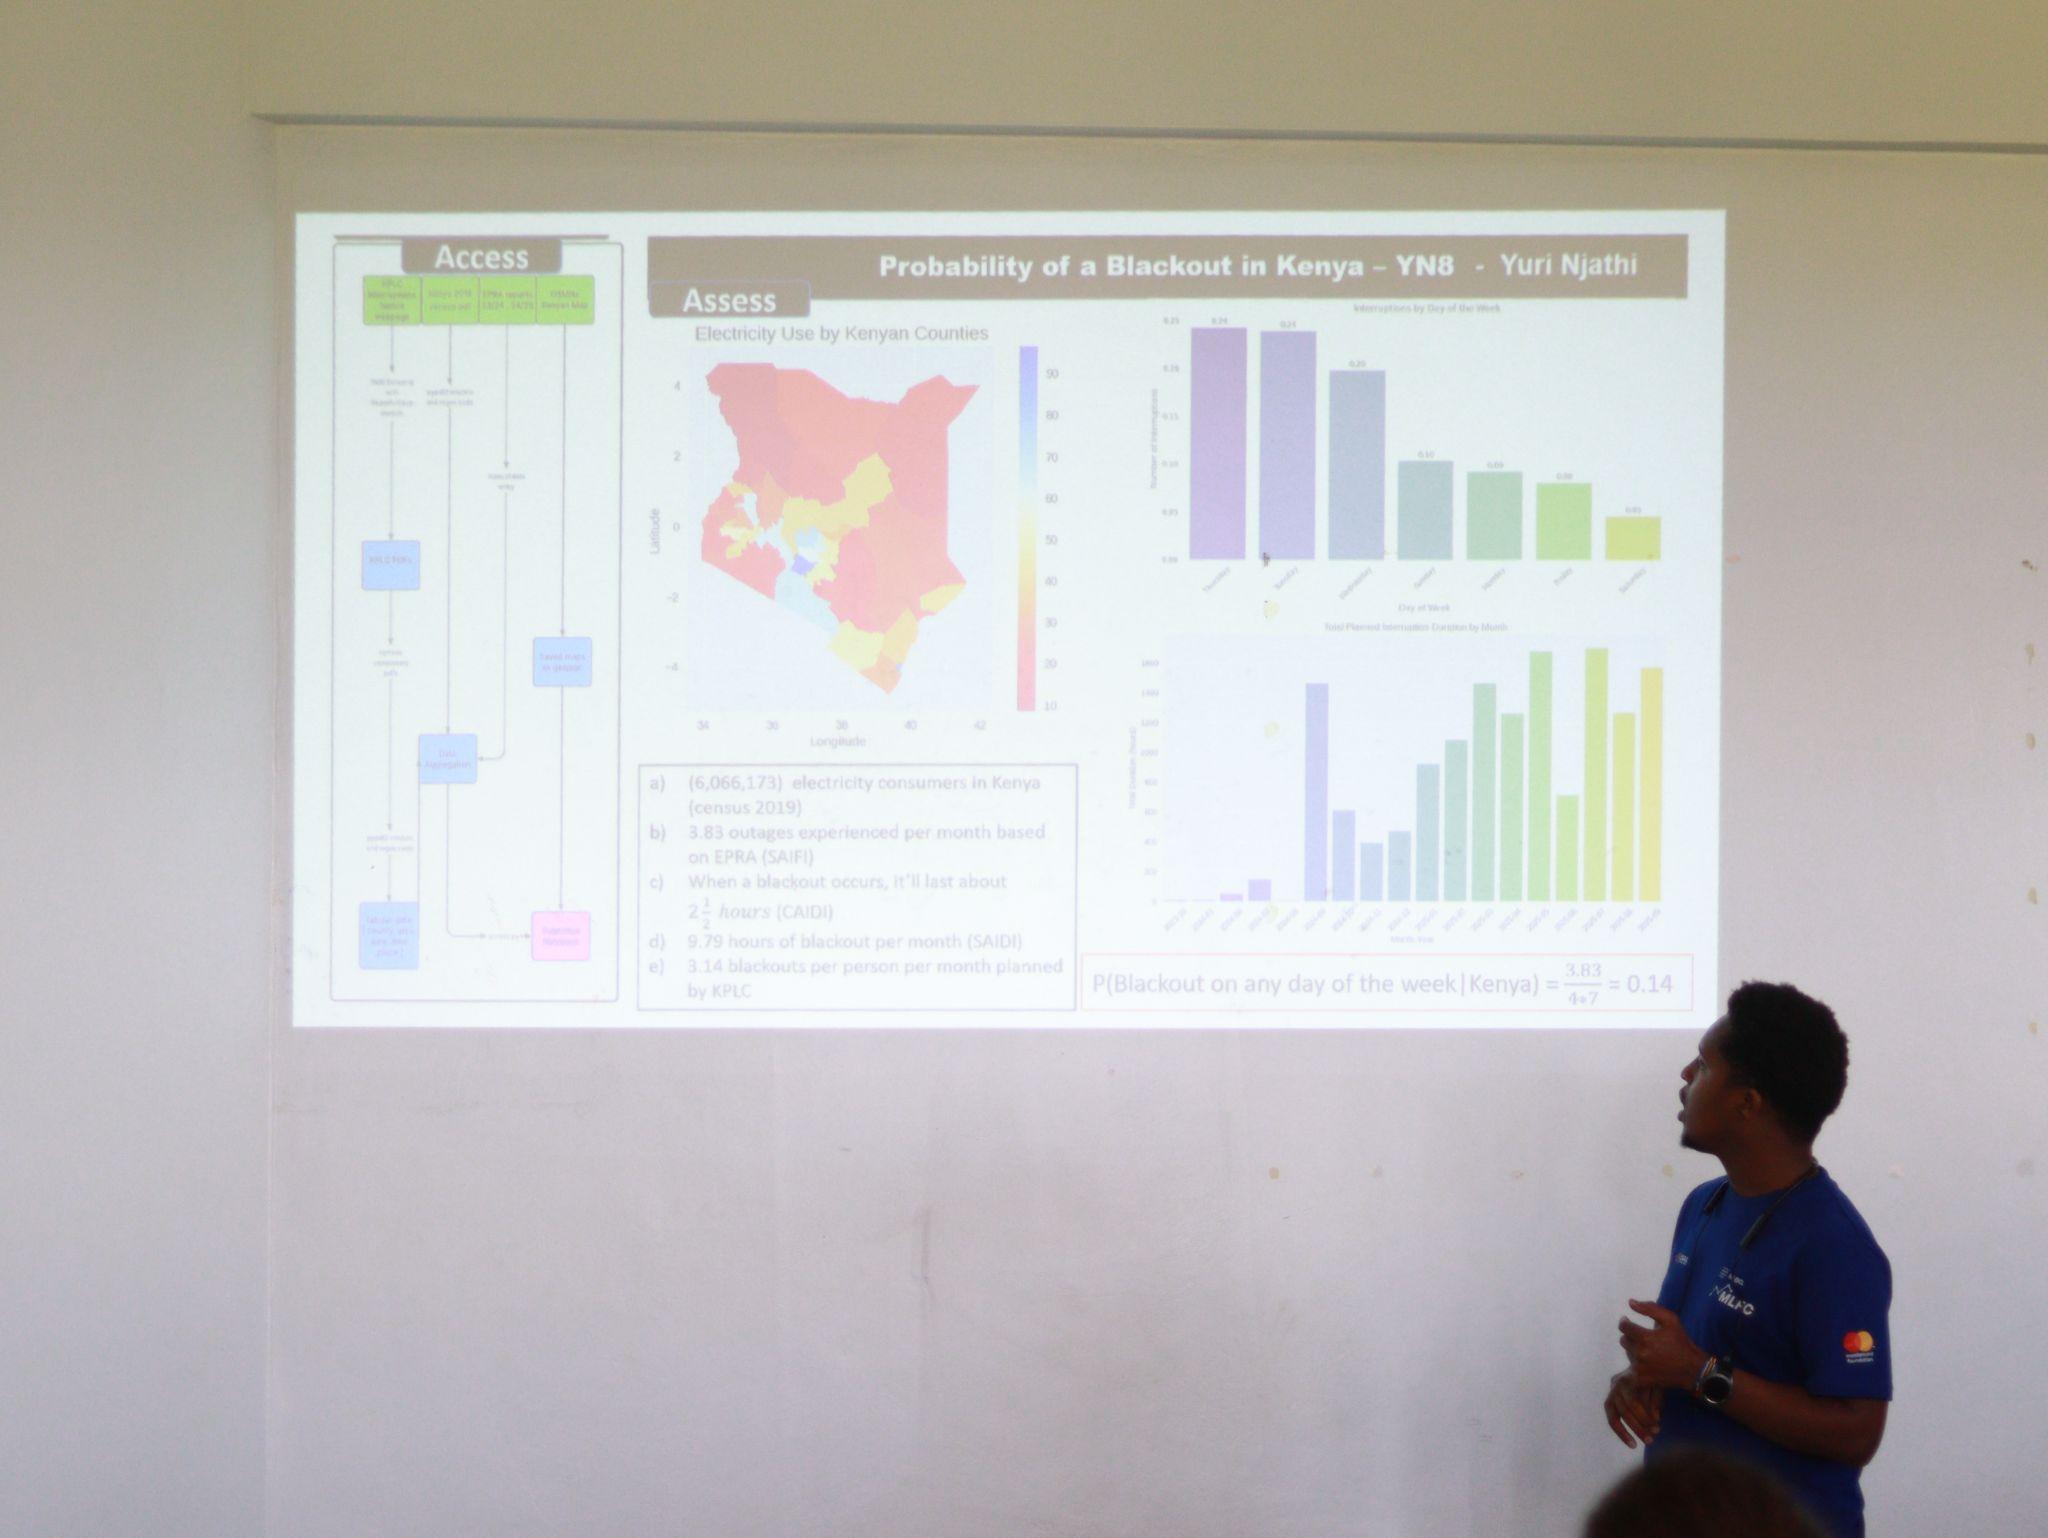
That said, the project found that the number of electricity consumers rose by 61% from 6.07m in 2019 to 9.85m in 2025, as Kenya targets 100% renewable energy by 2030. Counties with cities, such as Nairobi, Nakuru, Mombasa and Eldoret, had above 60% electricity use, with the only outlier being Kisumu county with 53% connectivity (just above the country average of 50.4%) as seen in the figure below. Also, counties closer to Nairobi County (where the capital lies) had higher rates of connectivity. Overall, the southern part of Kenya was more connected to electricity.
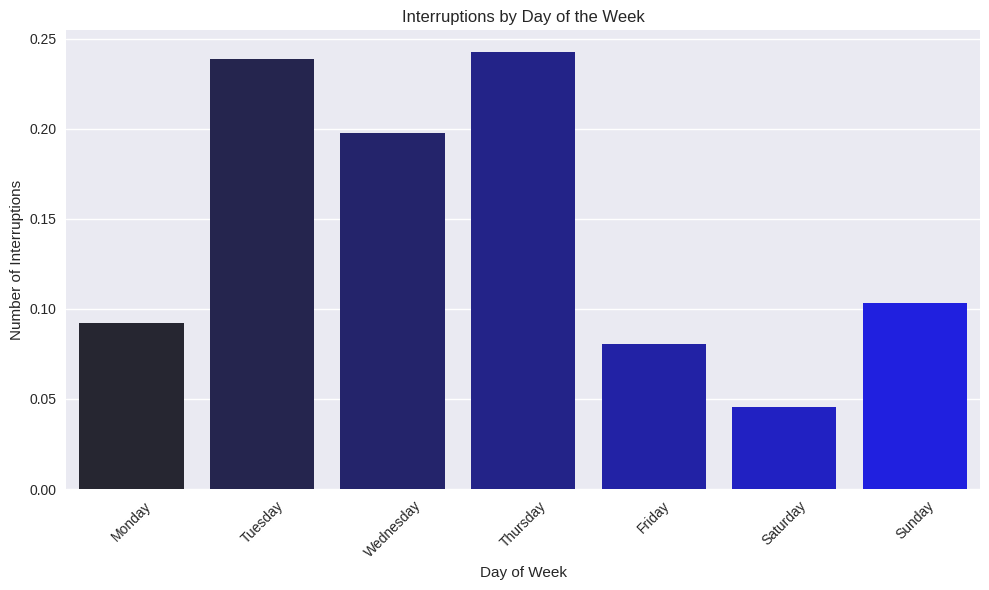
Planned interruptions have become more frequent but also more purposeful, with households averaging 3.81 outages a month, 3.14 caused by planned interruptions, typically lasting 2.5 hours. Most planned interruptions are expected on Tuesday, Wednesday and Thursday.
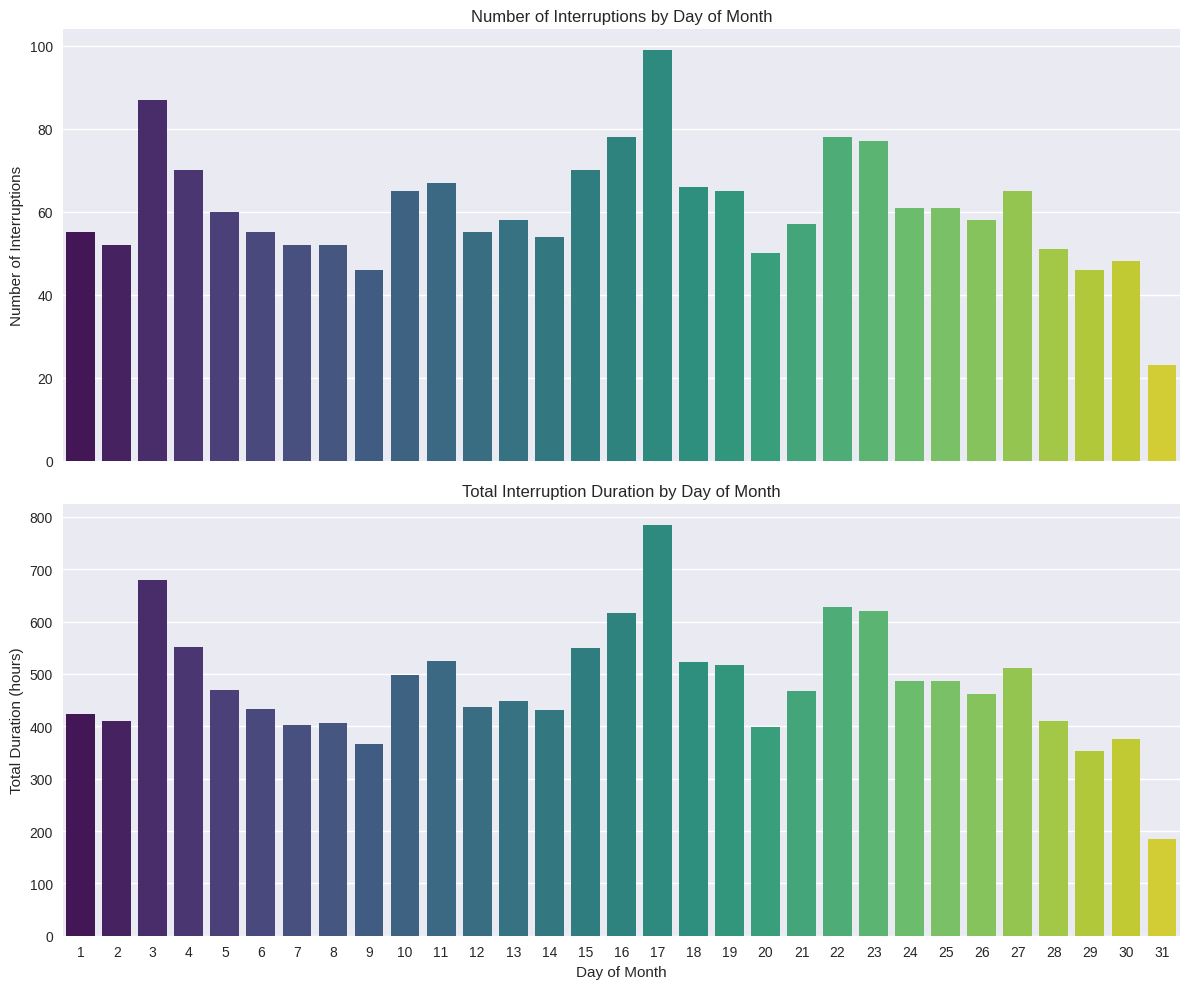
Planned interruptions by day of month appear to occur more on the 3rd, 17th and 22nd days but are spread out across the month.
By utilising the data obtained, this project demonstrates how one can have a sneak peek into Kenya’s Energy Grid and Reliability, the project estimated the overall probability of a blackout at 0.14. Similarly shown below.
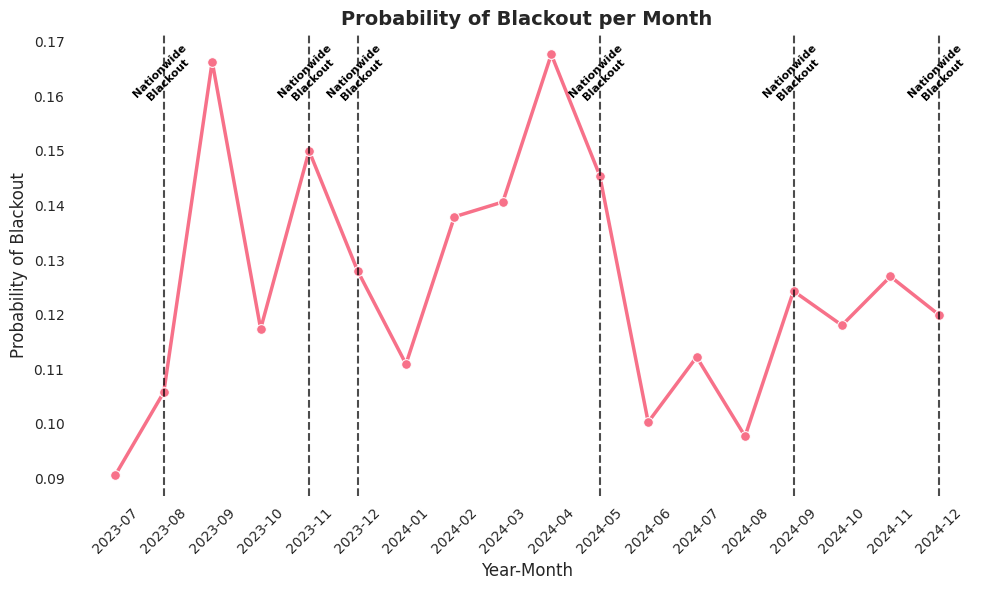
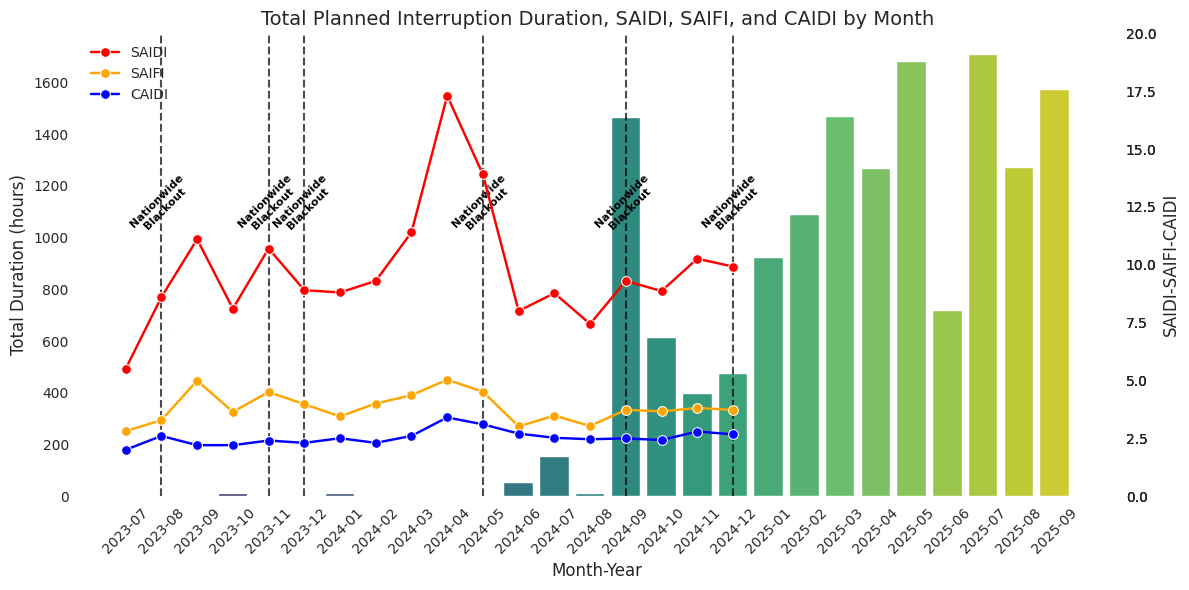
The finding was independently confirmed by the System Average Interruption Frequency Index (SAIFI) reliability index (0.136) and interruption data (0.143). The closeness of the alignment strengthens confidence in the assessment done. The convergence of these two probabilities suggests that KPLC has adopted a more proactive approach to system reliability by strategically scheduling maintenance interruptions to preempt unplanned failures. With an increase in planned and notified interruptions since 2023, as shown below.
This may mark a shift toward anticipatory grid management, where “useful” planned outages replace “useless” unplanned interruptions that offer no preventative benefit, as shown above. The impact of the percentage of electricity use is clear from the figure below. Showing how highly electrified areas experience more maintenance (as expected).
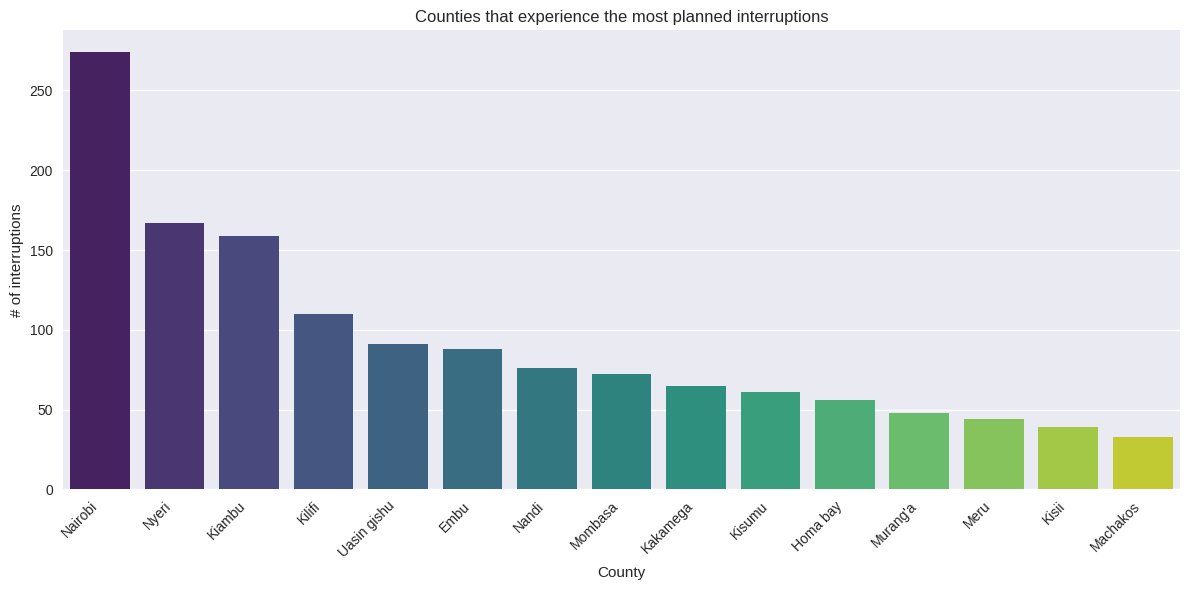
Counties such as Nairobi, Nyeri, Kiambu and Kilifi experience higher scheduled outage density due to maintenance prioritisation, accounting for 10%, 7%, 6% and 5% of planned interruptions, respectively. These counties had either high electrification rates or high populations near a critical urban area. For the use of renewable electricity sources to continue to increase, power reliability must improve rather than decline. The proactive maintenance by KPLC is further emphasised by the figure below, which shows planned interruptions or notice of planned interruptions increase after these nationwide blackouts, with 2025 having zero recorded nationwide blackouts.
Conclusions
I suppose with the nationwide blackouts, we can say "When the well is dry, we know the worth of the water. The same is true for electricity”.
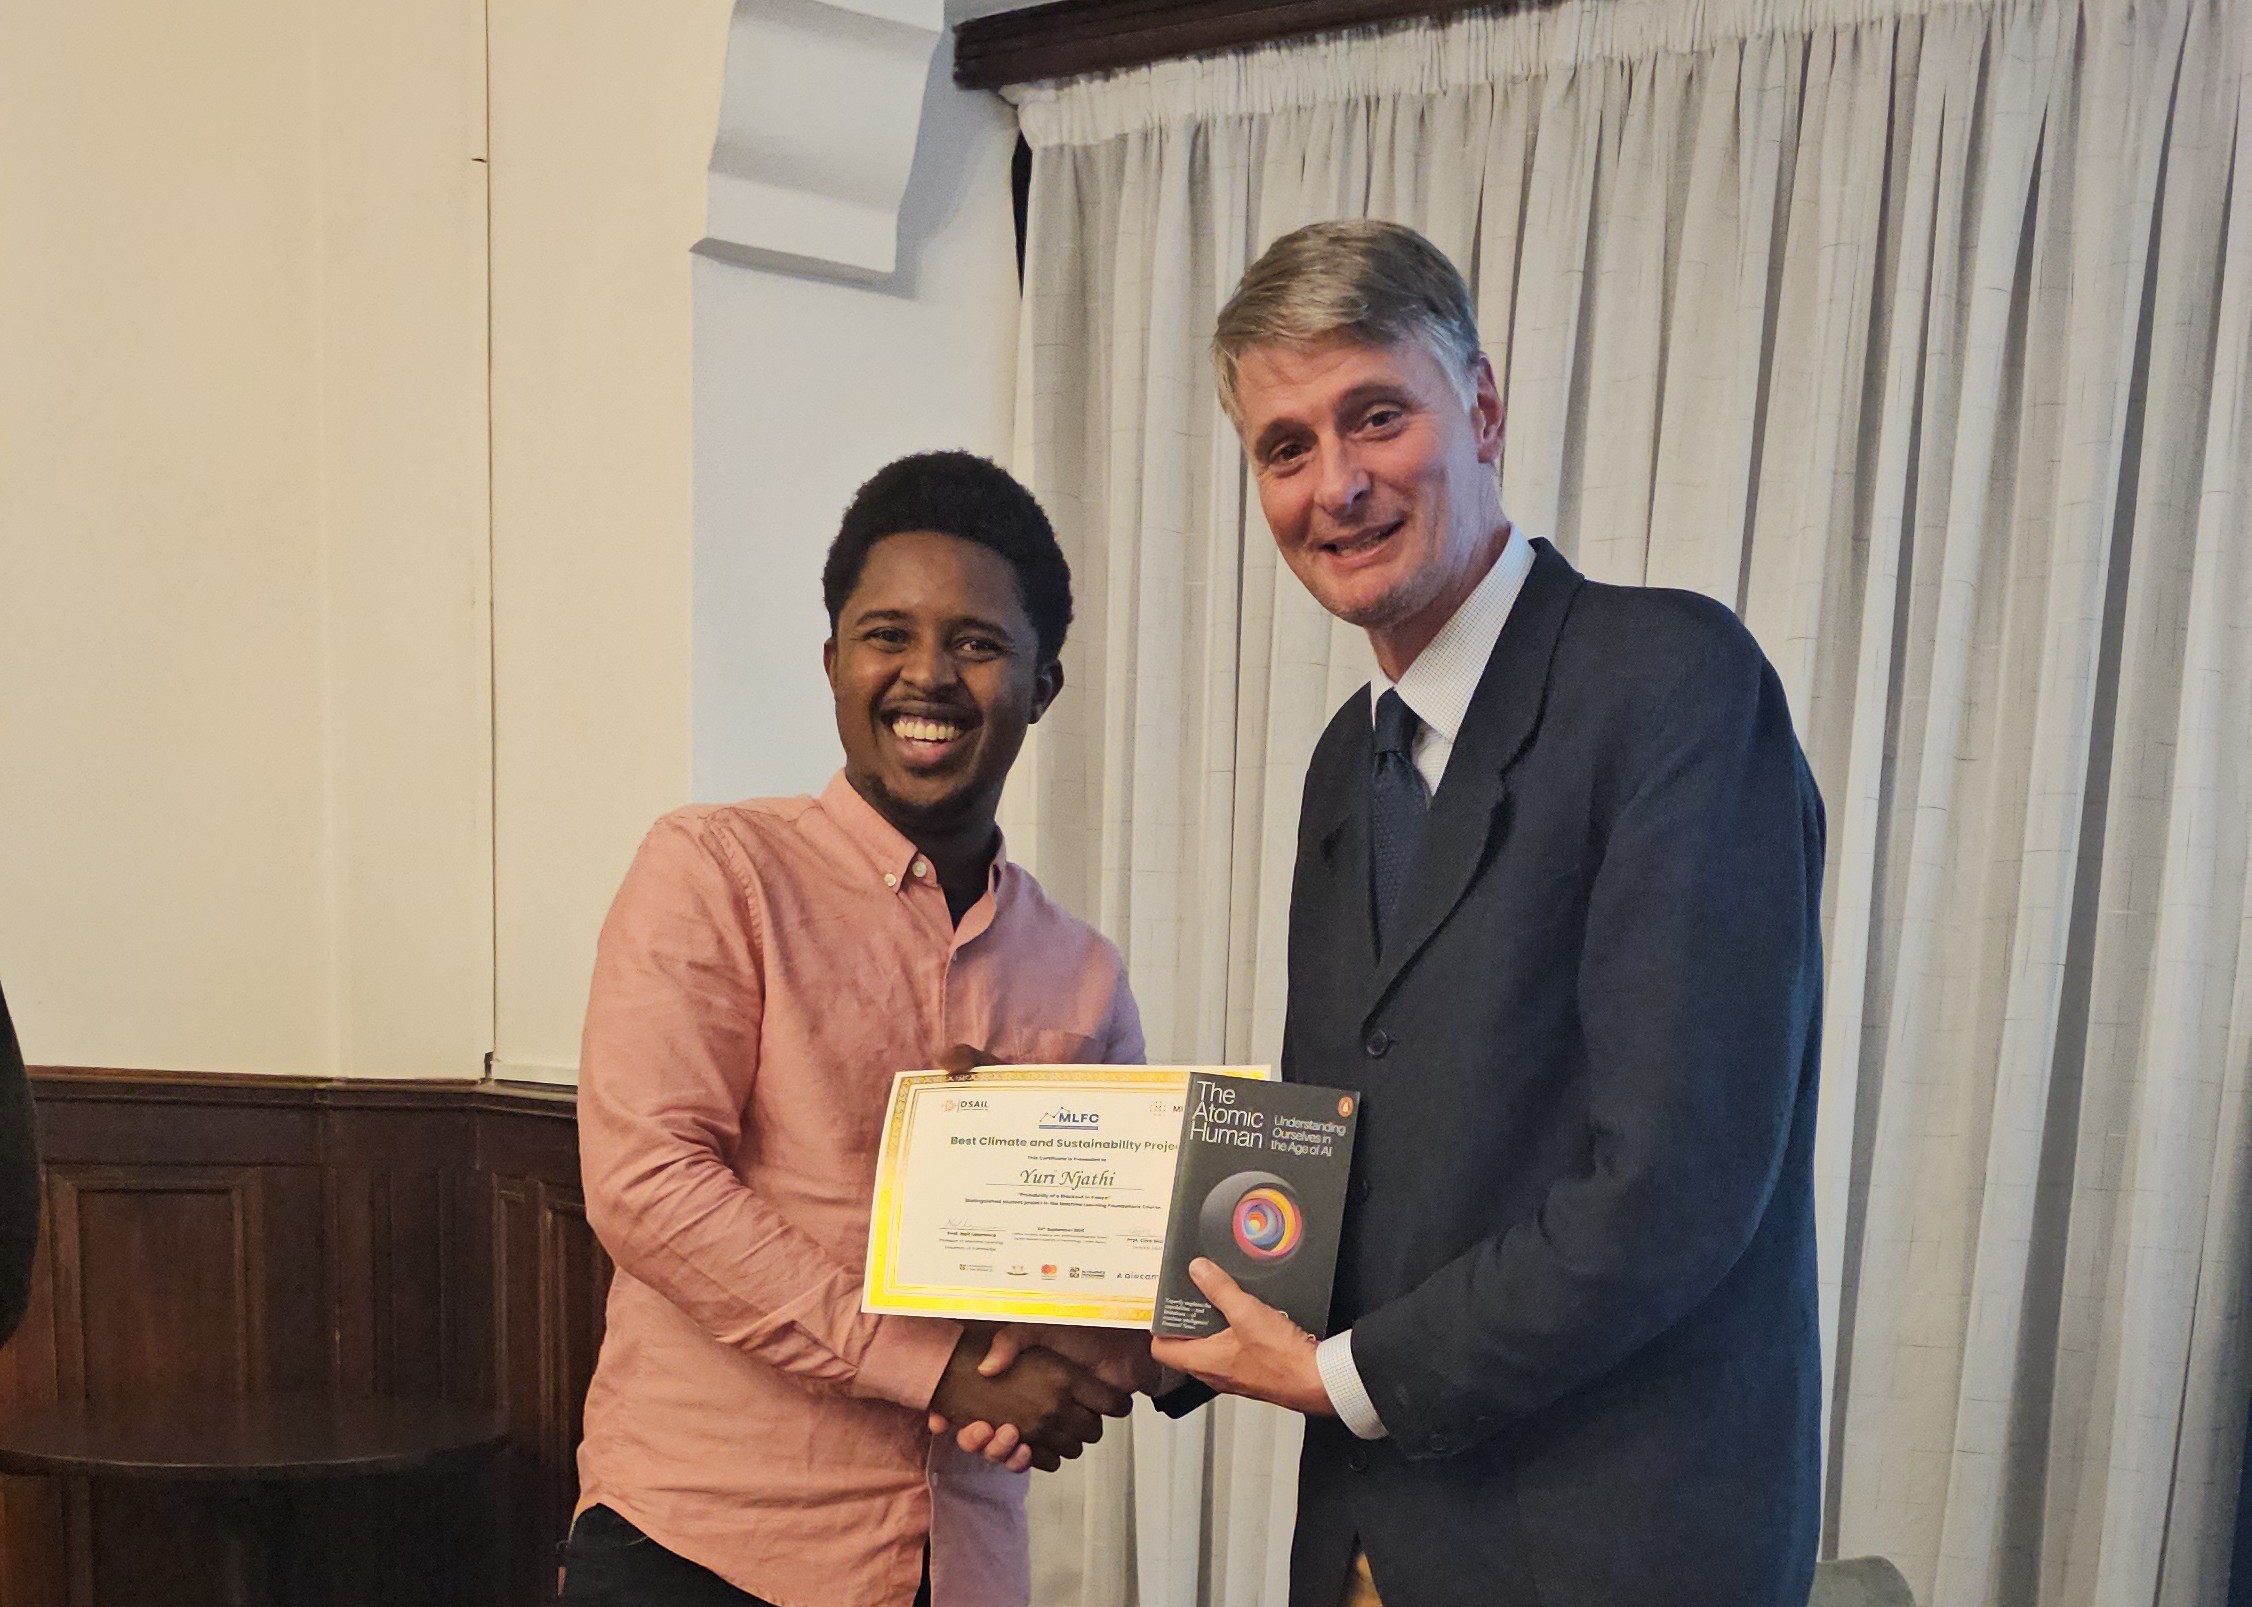
For my work, I was awarded "the Best Climate and Sustainability Project prize". I appreciate the gravity of the prize because of the exceptional projects I saw presented at the lab. For a hands-on look at the data, please find the full project notebook at the top of the page.
About the Course
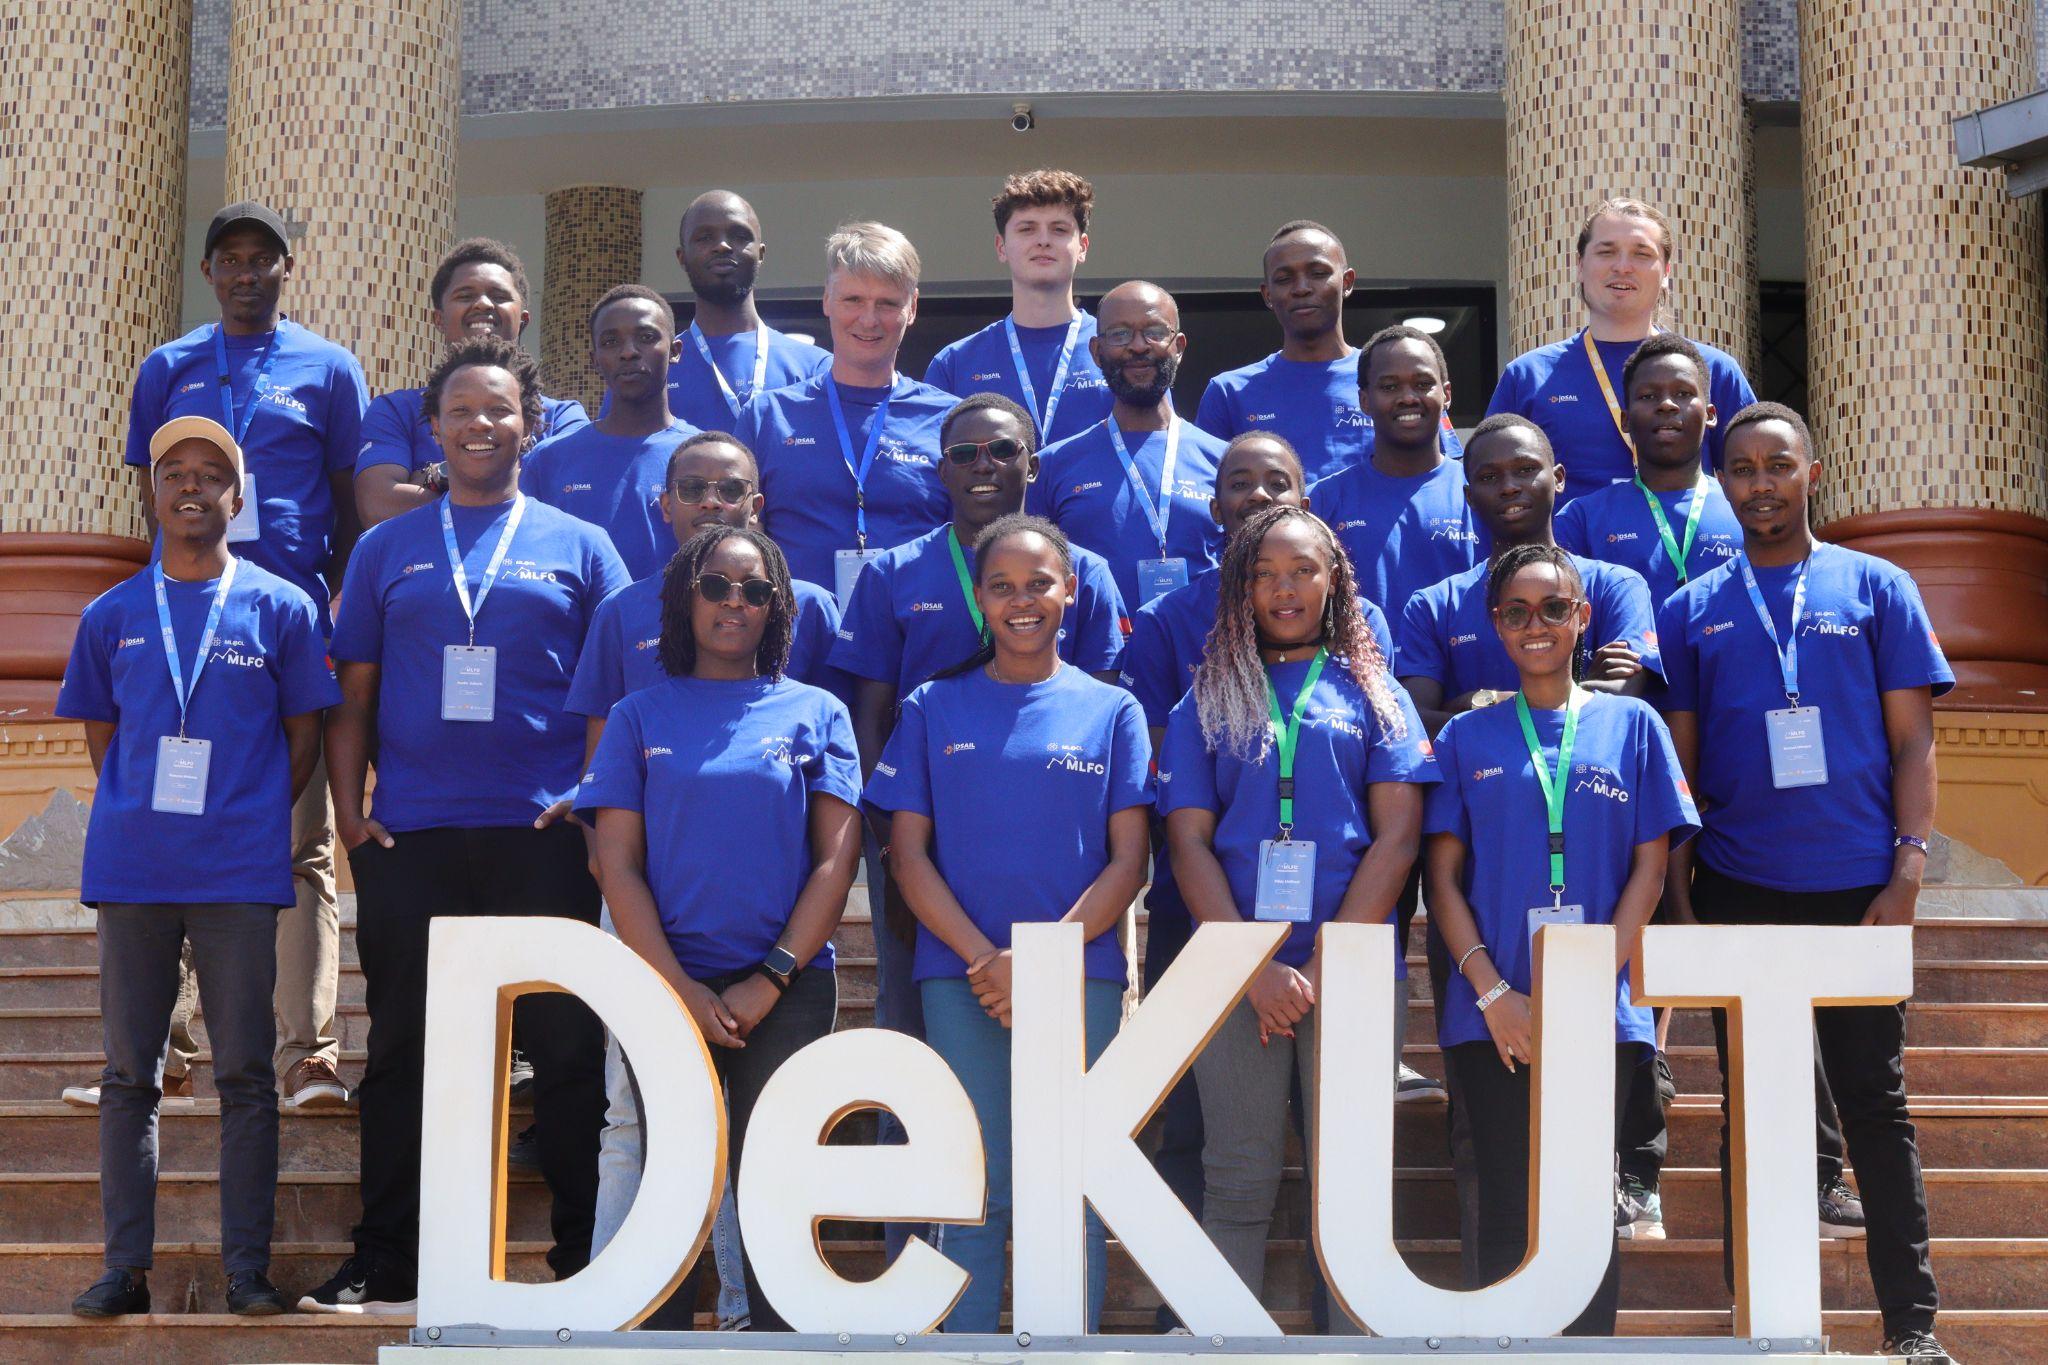
In September of 2025, I had the opportunity to be part of DSA’s Machine Learning Foundations Course led by DeepMind Professor of Machine Learning, Professor Neil Lawrence at Prof. Ciira wa Maina’s DSAIL Lab within Dedan Kimathi University of Technology. The course involved lectures in Probability, Basis Functions and Generalisation, Gaussian Processes, up to Deep Architectures. There were also six associated practical sessions with guidance from Radzim Sendyka, Fred Lawrence, Cedric Kiplimo and Austin Kaburia.
The sessions centred on code reusability around the Access-Assess-Address Framework and the importance of having common data variables to merge several datasets, particularly ID, time and geospatial data. The course was intensive as it also required each of the 20 or so participants to instantiate a data science mini-project from scratch using Kenyan data that would be relevant for new data storytelling within the Kenyan context. As someone with mostly engineering experience, I found myself especially benefiting from the computer science-like experience that this course gave me, particularly interacting with Open Street Maps, a deep dive into advanced pandas and the importance of algorithmic efficiency in time and computation. During the course, I experienced several instances where 4 or 5 lines of code that took about 3 minutes to run would be replaced with 1 line that took half a second to run.
I deeply thought about what and how I would formulate my own miniproject around what I was learning from the course. Given my deeper electrical engineering experience, I thought it would be prudent to continue to follow that route. I was encouraged to do so, given the sparsity of electricity data in Kenya.

Despite knowing about the efficiencies of array manipulation with NumPy, being guided in person by professionals with strong computer science backgrounds proved invaluable. Their instruction helped me grasp advanced data science concepts through the lens of objective functions. As Richard Feynman once said, “The thing that doesn't fit is the thing that's the most interesting: the part that doesn't go according to what you expected.” Moreover, we got to play four rounds of 2-hour football, 1 each Wednesday evening, where I really got to appreciate how fitness, communication, intensity, teamwork and the goal post affect match results.


Overall, it was quite a good, professional and humanised experience that will have lasting positive effects.