

Accidents Black Spot Mapping in Kenya
Introduction
I was privileged to attend a month-long Machine Learning Foundations Course (MLFC) by Prof. Neil Lawrence. It was an eye-opening experience that deepened my understanding of how machines learn from data. The course took us from the fundamentals of probability and linear algebra to exploring how linear models uncover patterns, how basis functions capture complex relationships, and how techniques like Bayesian regression and Gaussian processes model uncertainty. We also explored unsupervised learning through clustering and concluded with an introduction to neural networks. Beyond the technical lessons, it was an inspiring journey of discovery and collaboration. The knowledge I gained directly inspired my project on Accident Blackspot Mapping in Kenya, where I applied these concepts to identify high-risk roads using real data. Overall, the MLFC was not just an academic experience but a meaningful step toward using data and machine learning to solve real-world problems.
Project Outline
Every year, thousands of road users in Kenya are affected by accidents, many of which are preventable. This project’s goal is to identify accident black spots in Kenya by mapping crashes recorded between 2012 and 2023, assigning risk factors to road segments, and ultimately using those insights to recommend safer driving routes. I hope that by doing so, there might be a substantial decline in the number of observed accidents annually.
The work focuses particularly on Nairobi County, where high population density, traffic congestion, and diverse road users make road safety a pressing issue. The dataset powering this project captures reported road crashes from 2012 to 2023 across Kenya, with detailed timestamps, geolocations, and descriptions of the incidents.
By expanding the crash_datetime column into year, month, hour, and day-of-week, I was able to analyse temporal crash patterns. Then I built a GeoDataFrame to integrate the crash points with Kenya’s road network, thus mapping each crash to a specific road on which it occurred. This was done with the aid of OSMnx and Folium libraries.
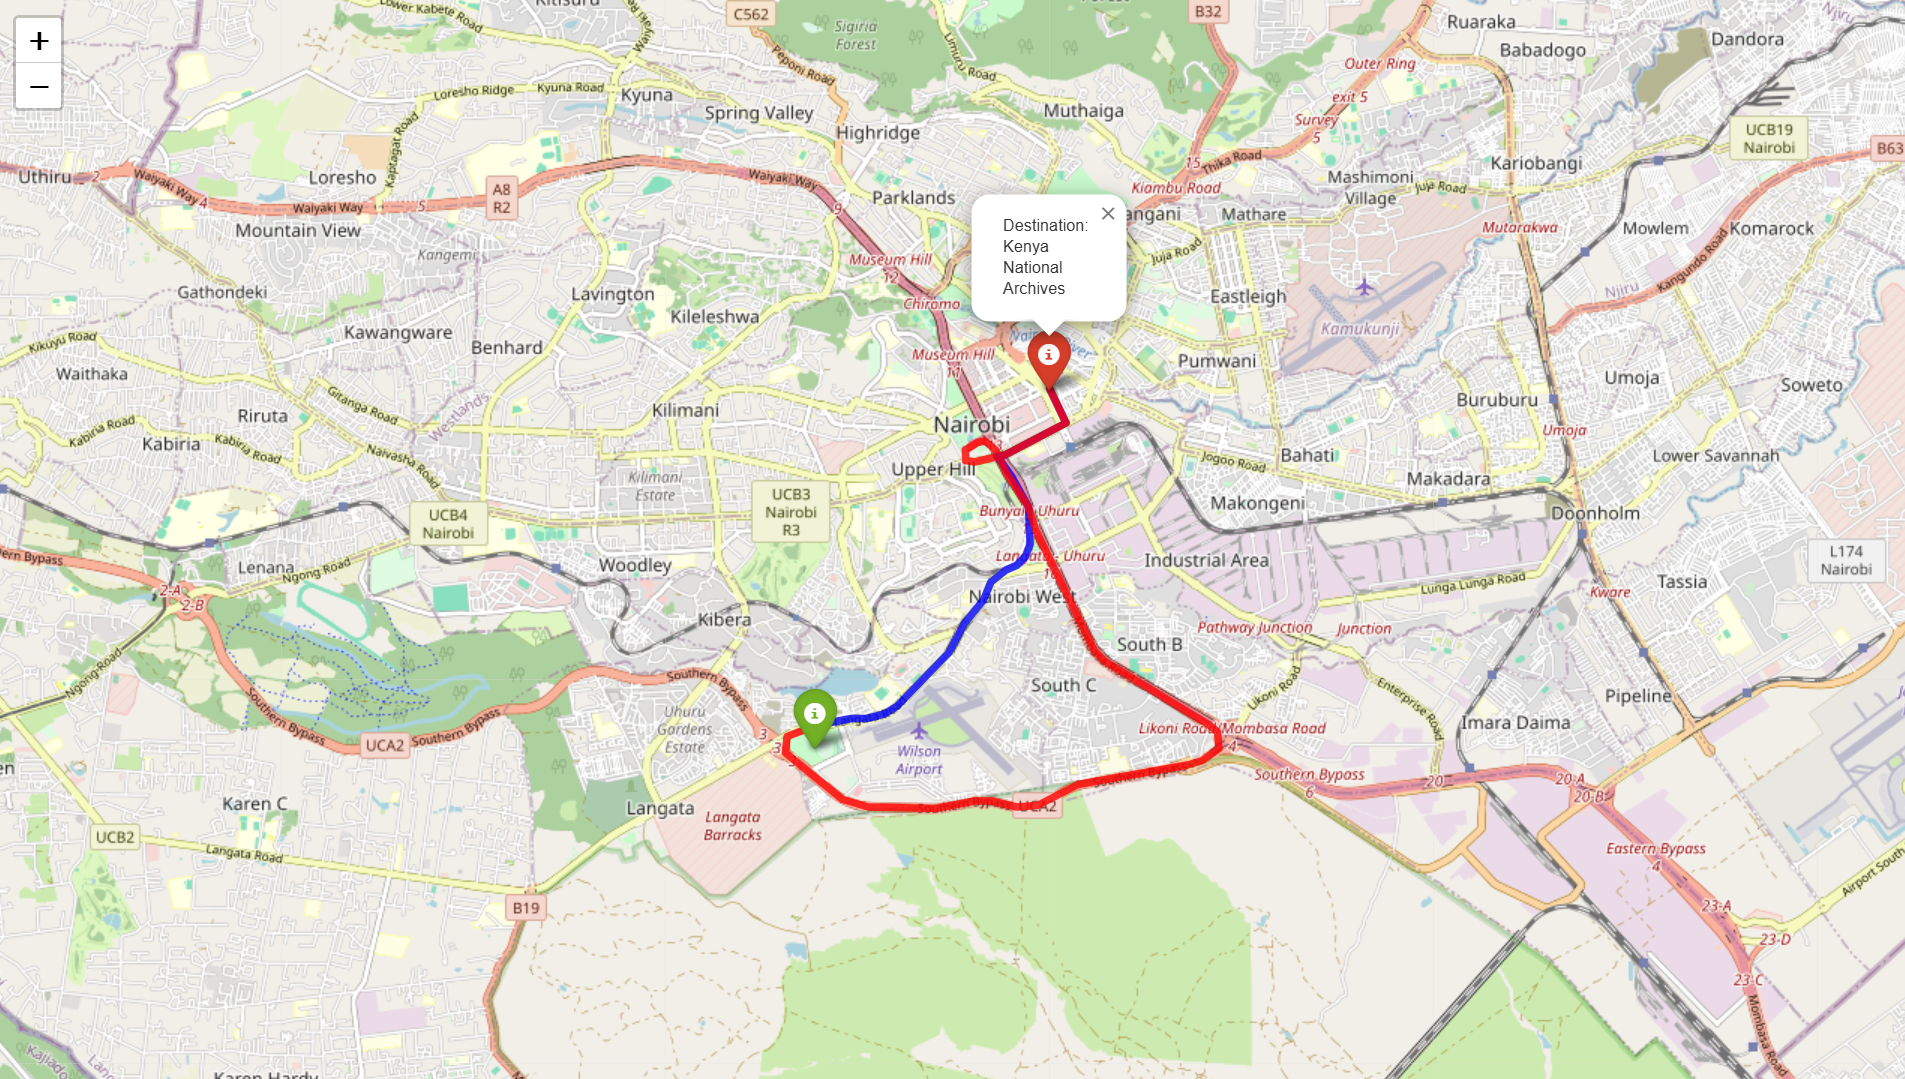
By mapping crashes to nearest road segments, the roads were assigned risk factors, which aided in the calculation of a safer route to avoid roads which are accident-prone. I then created a graph that, when given user start and destination location within Nairobi, gives both a safe route (red) and a shortest route (blue) — “the shortest route does not take the probability of accidents occurring into account.”
Monthly Accident Distribution
This information helps us to spot any months that have, over the years, had a higher accident rate than others in order to try and find out why said months are more affected and preferably enforce stricter policies and road traffic monitoring during said months.
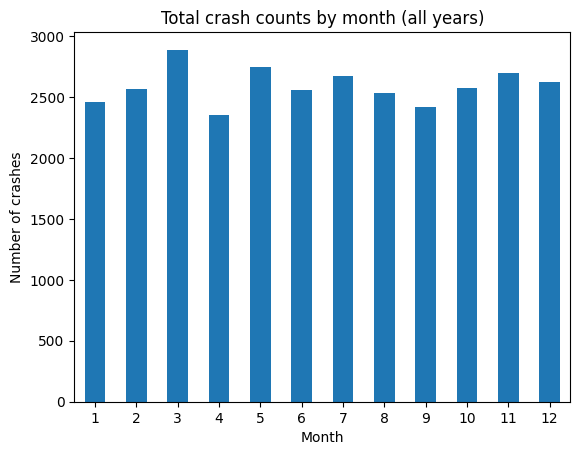
This shows that there is no particular pattern for accident occurrences over the years — all months are equally prone to accidents and require equal amounts of care.
What Time Do Accidents Occur Most
This information will aid us to understand the human and behavioural side of the problem, to what extent human behaviour influences accident occurrences.
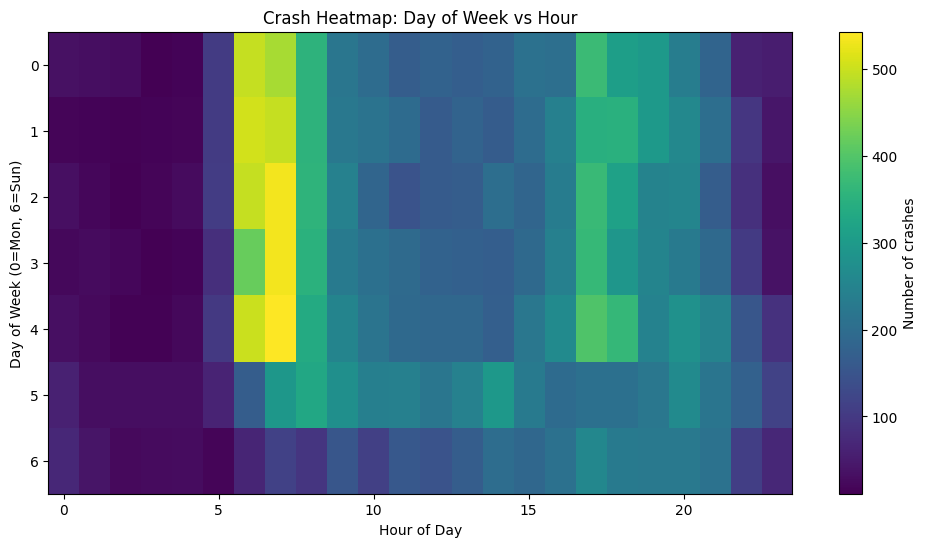
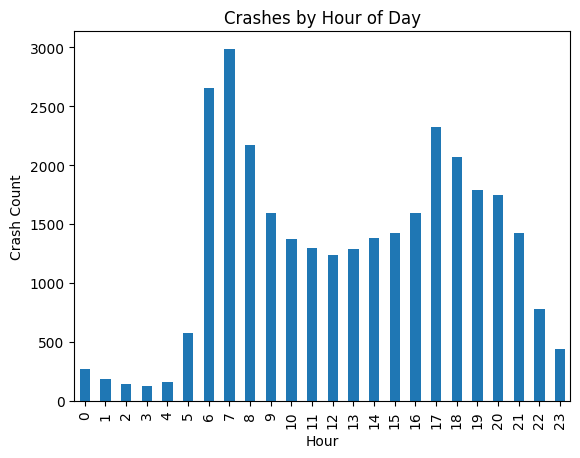
This tells us that most accidents occur around 7am in the morning and 5pm in the evening from Monday to Friday. This leads to the assumption that the crashes are probably caused by the from- and to-work/school rush at said times. This implies that stricter measures should be taken at this time by the road traffic authority and all alternative routes put to good use in order to decongest main roads at this time, thus reducing accidents.
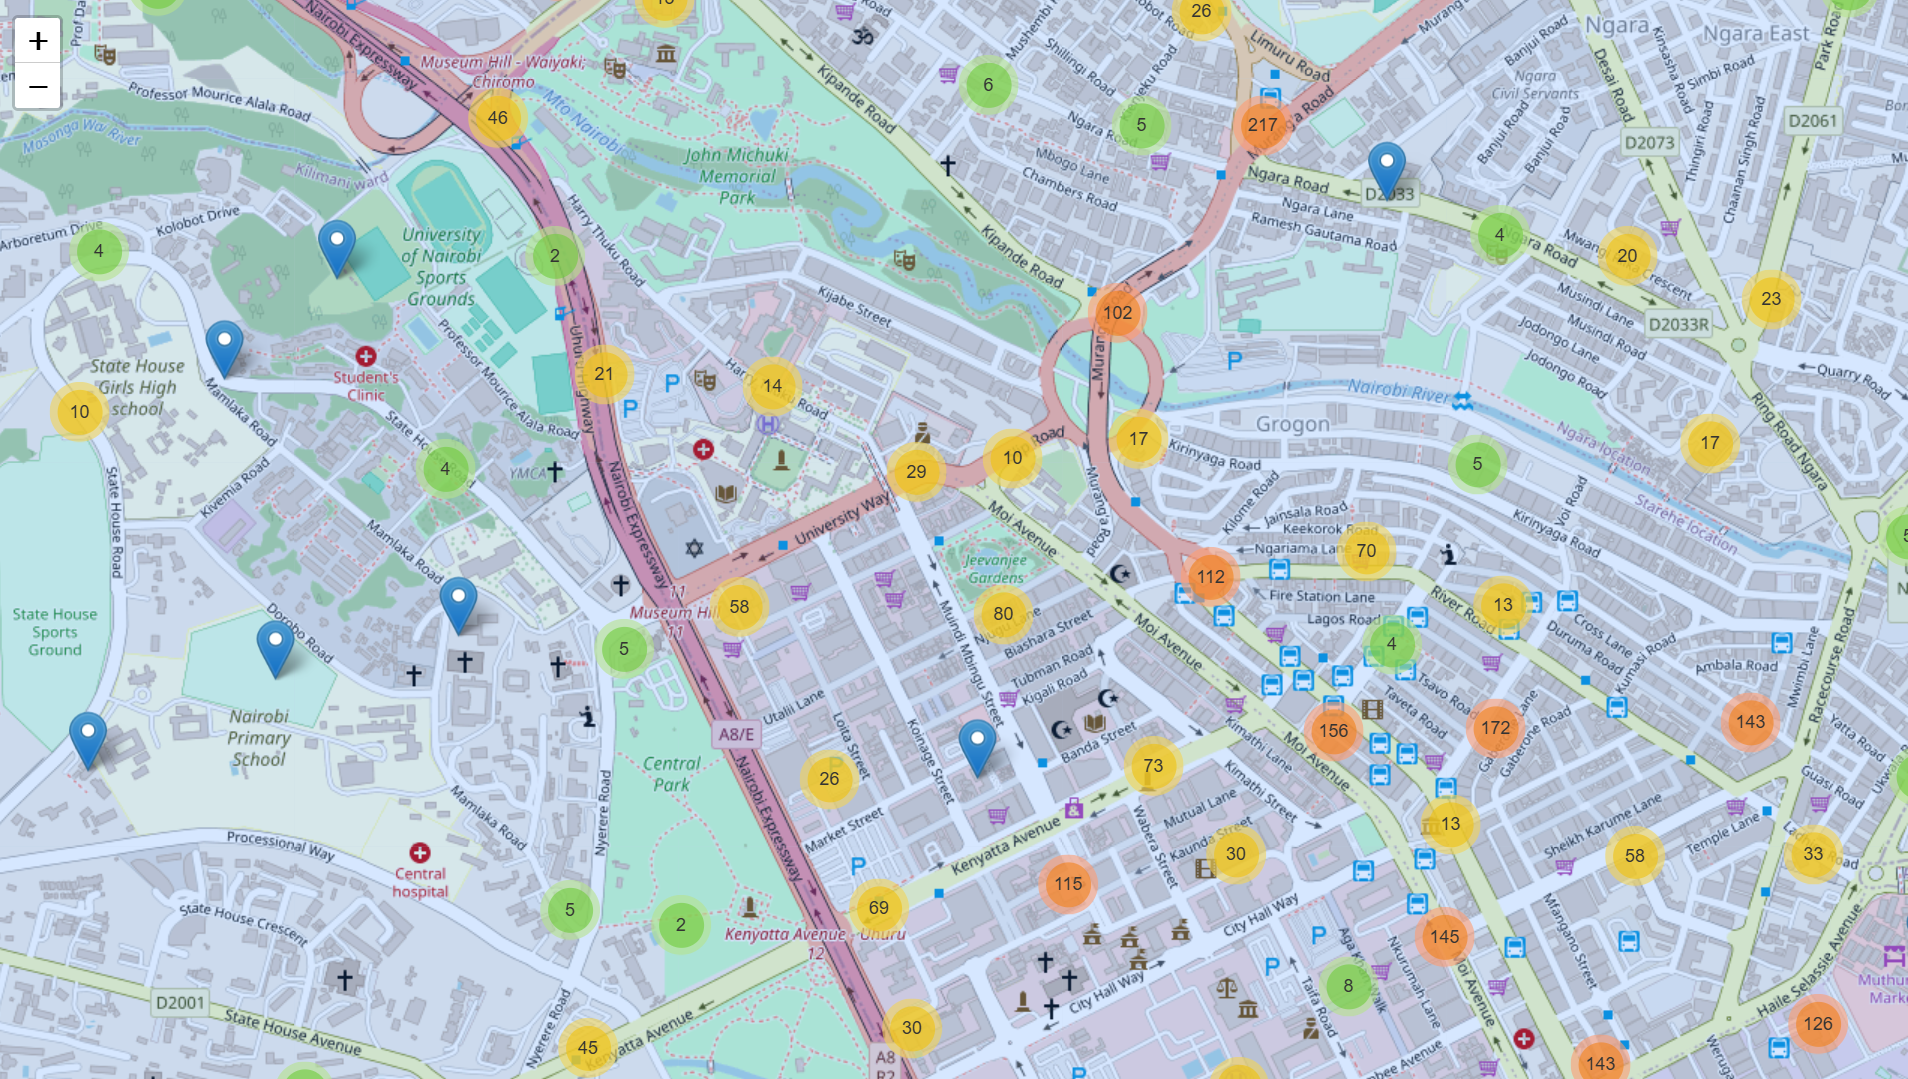
Mapped Crash Points
By mapping the crash points to the nearest road segment, we get a visual outlook on which road segments are more accident prone. This is very important especially for the safe route recommendation part, where the number of mapped accidents per segment shall be used to assign a risk factor.
Recommended Safe Route
These are safe routes, one from Kilimani to Upper Hill and the second from Archives to Uhuru Gardens, along with their shorter route alternatives. The safer routes, though longer, try to avoid high-risk road segments as much as possible, making this a choice between safety and time.
Further Work
Although this was a great project, it is still lacking in that it focuses mainly on Nairobi alone. Therefore, with sufficient data, I would love to be able to create blackspot maps for all the 47 Kenyan counties and have safe route recommendations for each in order to aid in a countrywide reduction in accident occurrences.
