
Introduction
According to the Kenya Master Health Facility List (KMHFL), the country has around 16319 registered healthcare facilities, yet their distribution is heavily skewed, with urban areas like Nairobi and Mombasa hosting most of these facilities, while remote counties such as Turkana remain severely underserved. For instance, Samburu County, which spans more than 20,182 km², has fewer than 5 health facilities per 100,000 people, compared to Meru with 23 facilities per 100,000 people. Leveraging machine learning to predict underserved regions provides an evidence-based approach to inform equitable resource allocation, optimise new facility placement, and support Kenya’s Universal Health Coverage (UHC) 2030 goals.
Data Collection
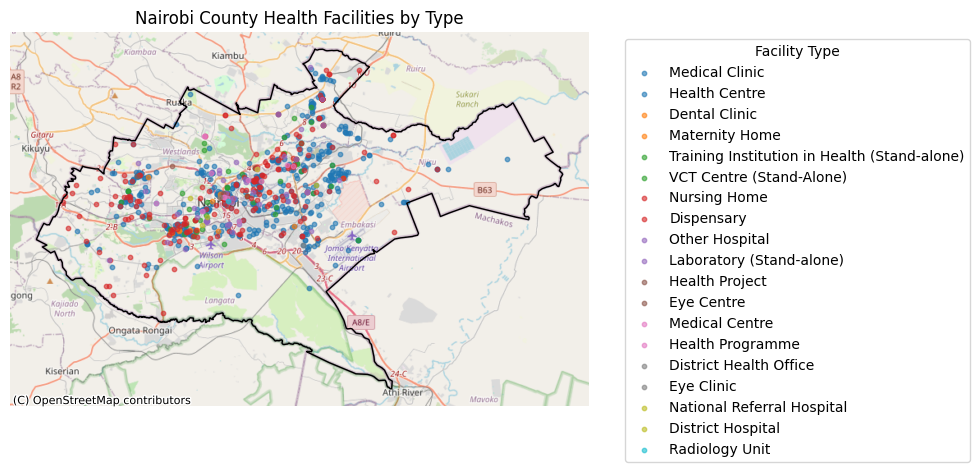
We collected healthcare facility data together with the 2019 Kenya population census to evaluate facility distribution at the county level. To measure fairness in distribution, we calculated hospitals per capita. This benchmark is based on WHO guidelines, which recommend at least one hospital per 100,000 people. Using this index, we created a simple binary classification index:
0 (Underserved) → fewer than 1 hospital per 100,000 people
1 (Well-served)→ at least 1 hospital per 100,000 people
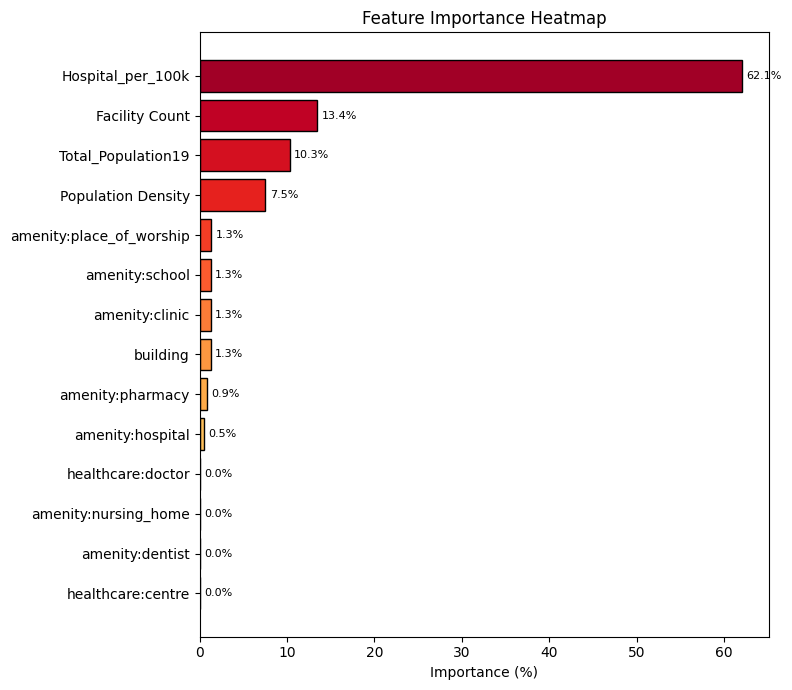
This binary index simplifies the complex, multi-dimensional problem of healthcare accessibility into a clear and interpretable framework for machine learning classification. The 0-1 representation enables the model to learn patterns and key determinants that separate underserved from well-served regions. To train the model, we excluded less important features in predicting the target variable and split the dataset into training and testing sets to validate model performance.
Results
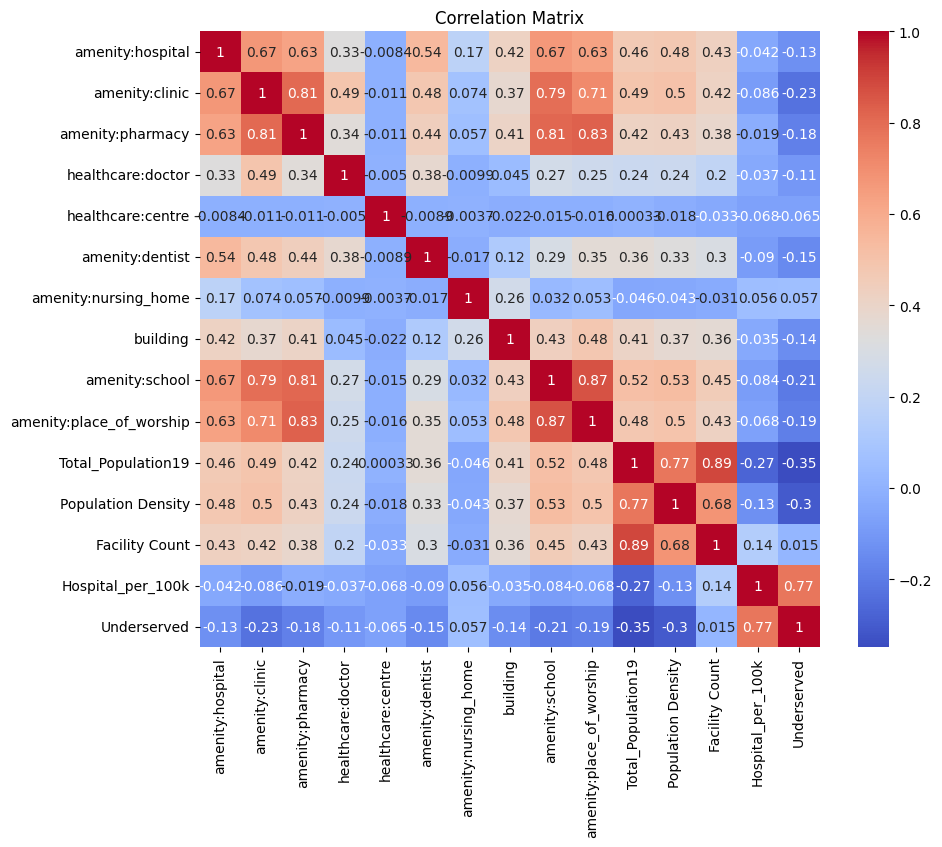
We trained two models to predict underserved regions: Logistic Regression and Naive Bayes. The Logistic Regression model achieved an impressive 97% accuracy, correctly classifying nearly every county, while Naive Bayes lagged behind at 69% accuracy. This significant difference explains the importance of choosing the right model for the problem at hand. Logistic Regression, which directly models the probability of a binary outcome based on a linear combination of input features, is particularly well-suited for datasets where relationships between variables are approximately linear and feature independence is limited. In contrast, Naive Bayes assumes that all predictors are conditionally independent, an assumption rarely true in the real world, where variables like population density, Total_population19, and Hospital_per_100k are highly correlated, as shown by the matrix below.
Drawing from Prof Neil's lectures, we learned that a good model isn’t just one that fits data well, but one whose assumptions match the structure of the data. Logistic Regression captures dependencies and interactions more effectively, allowing it to separate underserved and well-served counties with higher precision. This result reinforces the principle that understanding model assumptions is just as critical as evaluating model performance.
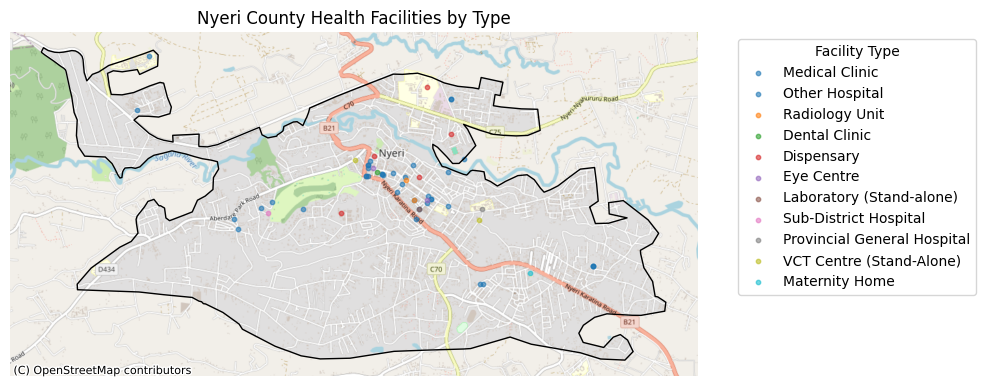
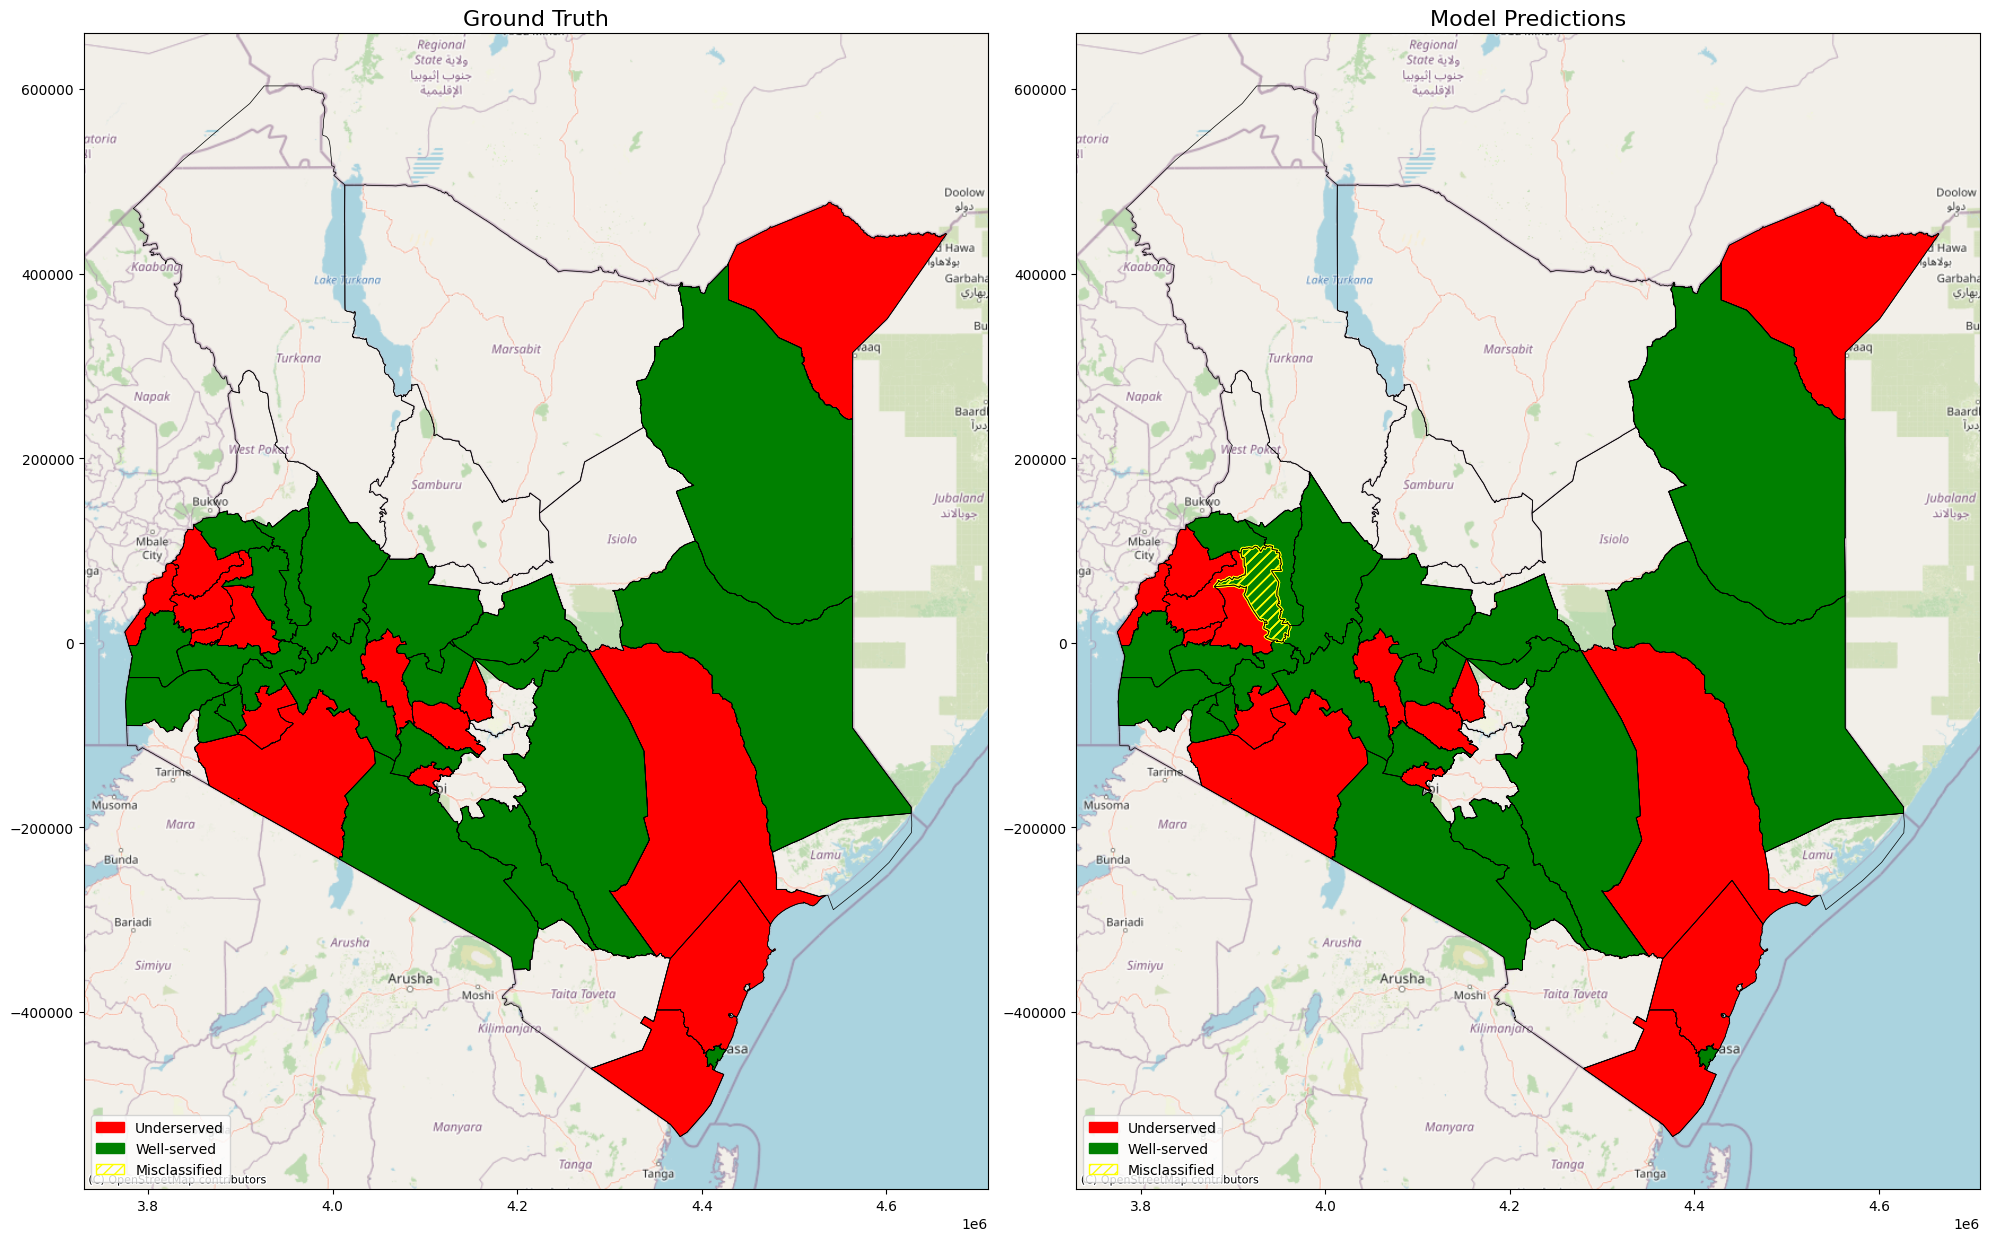
Using GeoPandas and Contextily basemaps, we created choropleth maps of Kenya showing ground truths and model predictions: Counties classified by the model. Counties shaded red are underserved, green are well-served, and yellow outlines highlight misclassifications. One county stood out (Uasin Gishu); it was actually well-served, but the model predicted it as underserved. This is as a result of most geospatial feature entries in the test samples within the county are zero, which is contrary to what the model was trained on, hence making errors in the prediction. Seeing that single misclassification visually highlighted both the model’s strength and its limitations.
About the Course
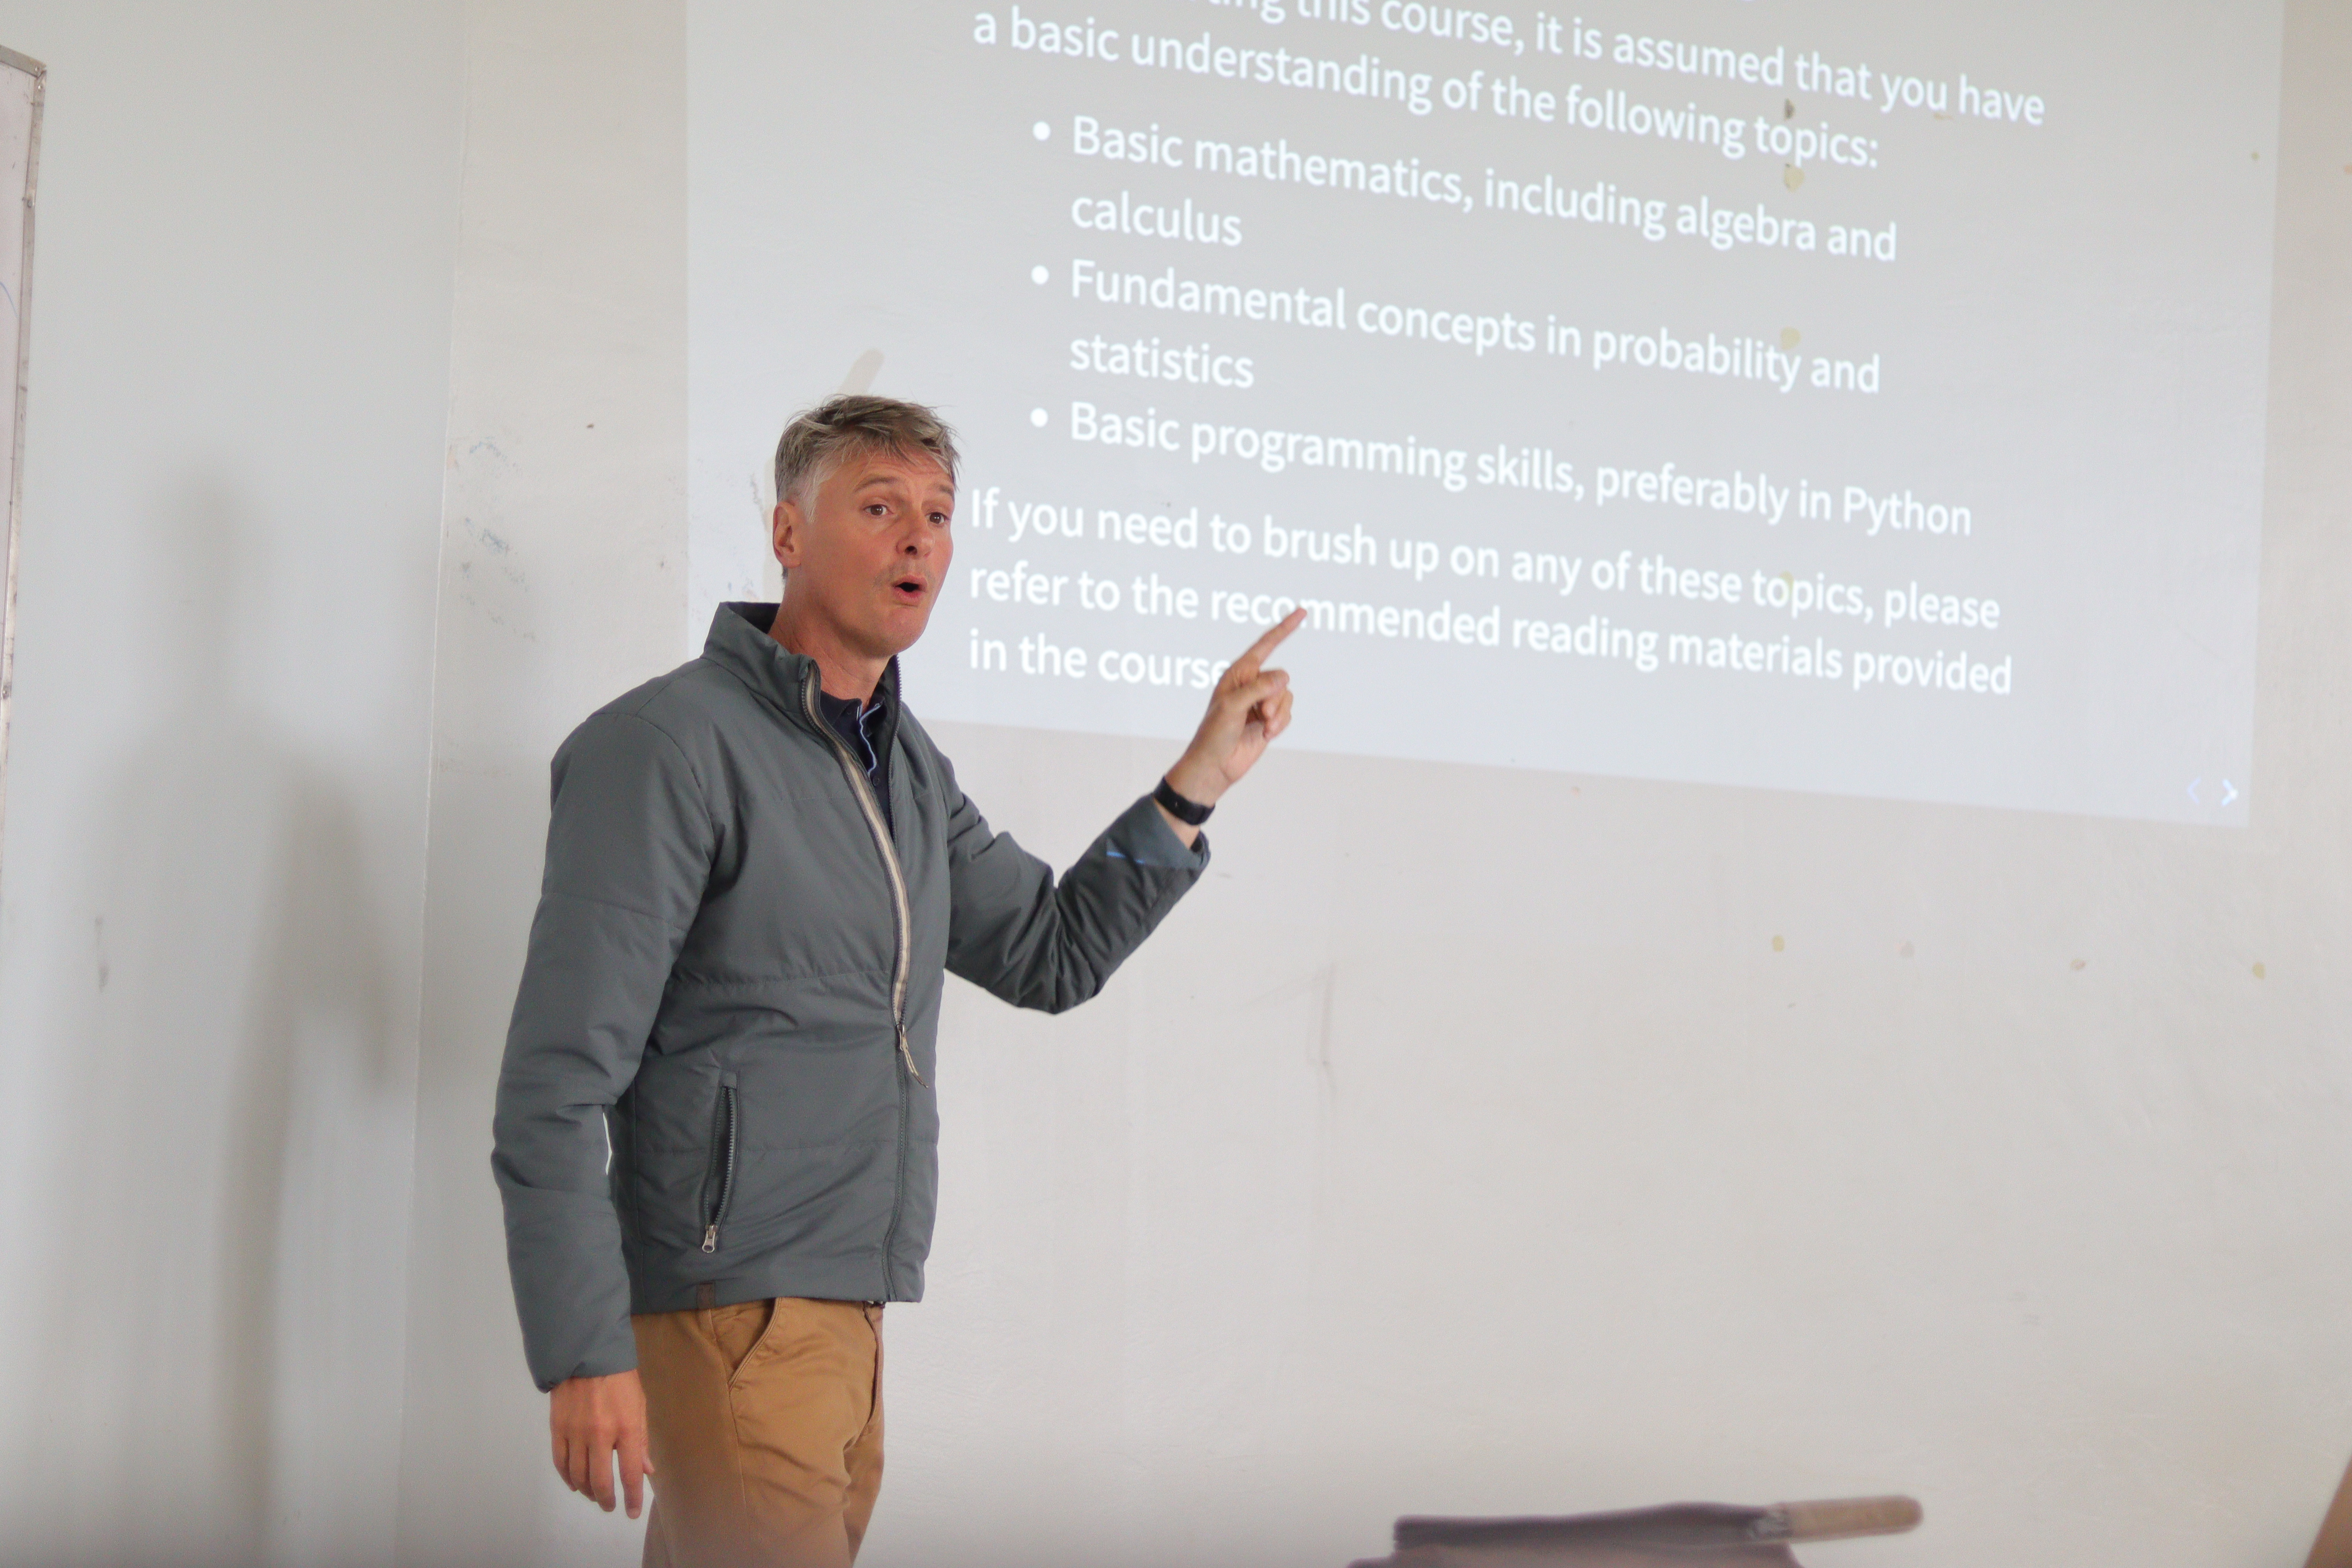
From September 1st to 24th, 2025, Prof. Neil D. Lawrence, the DeepMind Professor of Machine Learning at the University of Cambridge in the Department of Computer Science and Technology, delivered a Machine Learning Foundation Course (MLFC) at Dedan Kimathi University of Technology (DeKUT), Nyeri, Kenya. I am thrilled to share that it was an incredibly enriching experience that offered valuable opportunities to learn, connect and network.
Spotlight on the Lectures
The lectures started by introducing probability as the mathematical foundation of machine learning, framing uncertainty through distributions, expectations, and independence. It revisits fundamental rules such as the sum rule, product rule, and Bayes’ theorem to show how probabilities can be updated with new data. The session also ties these ideas to the interpretation of models in machine learning, explaining how probabilistic reasoning allows learning systems to manage noise and uncertainty effectively.
We were also taken through linear algebra, as the computational and conceptual backbone of linear regression. The lecture covered the objective function that involves loss minimisation and a probabilistic view that aims at maximising the likelihood, showing how these two describe the same underlying process. It emphasises matrix representations of data and vector spaces. Through all these concepts, we were able to see how linear algebra enables solving regression problems, reveals relationships between predictors, and clarifies how optimisation works at scale, which is key to understanding more advanced models.
Gaussian Processes were introduced as non-parametric Bayesian models that fundamentally operate by defining a distribution over functions, rather than a distribution over fixed parameters. Their significance lies in the fact that they extend the idea of Bayesian linear models by incorporating an infinite number of basis functions. This extension allows GPs to model complex, flexible relationships and, crucially, to provide inherent measures of predictive uncertainty for every prediction alongside the function estimate.
The lectures covered unsupervised learning, exploring how clustering algorithms group data without predefined labels. We examine k-means and hierarchical clustering models, highlighting their assumptions and different types of linkages used in creating the clusters. It then delves into the challenges of high-dimensional data, such as the curse of dimensionality, where distances become less meaningful and discusses strategies like dimensionality reduction to make structure discoverable again. The key insight is that understanding high-dimensional behaviour is essential for designing robust clustering methods and interpreting complex data landscapes.
Spotlight on Innovation: Mini-projects showcases
After a series of lectures, the course transitioned into working on mini-projects utilising concepts and frameworks such as Fynesse covered during the lectures and the practical session. This session provided us with an opportunity to present our projects, which involved different domains such as healthcare, agriculture, robotics, weather, transportation, etc.
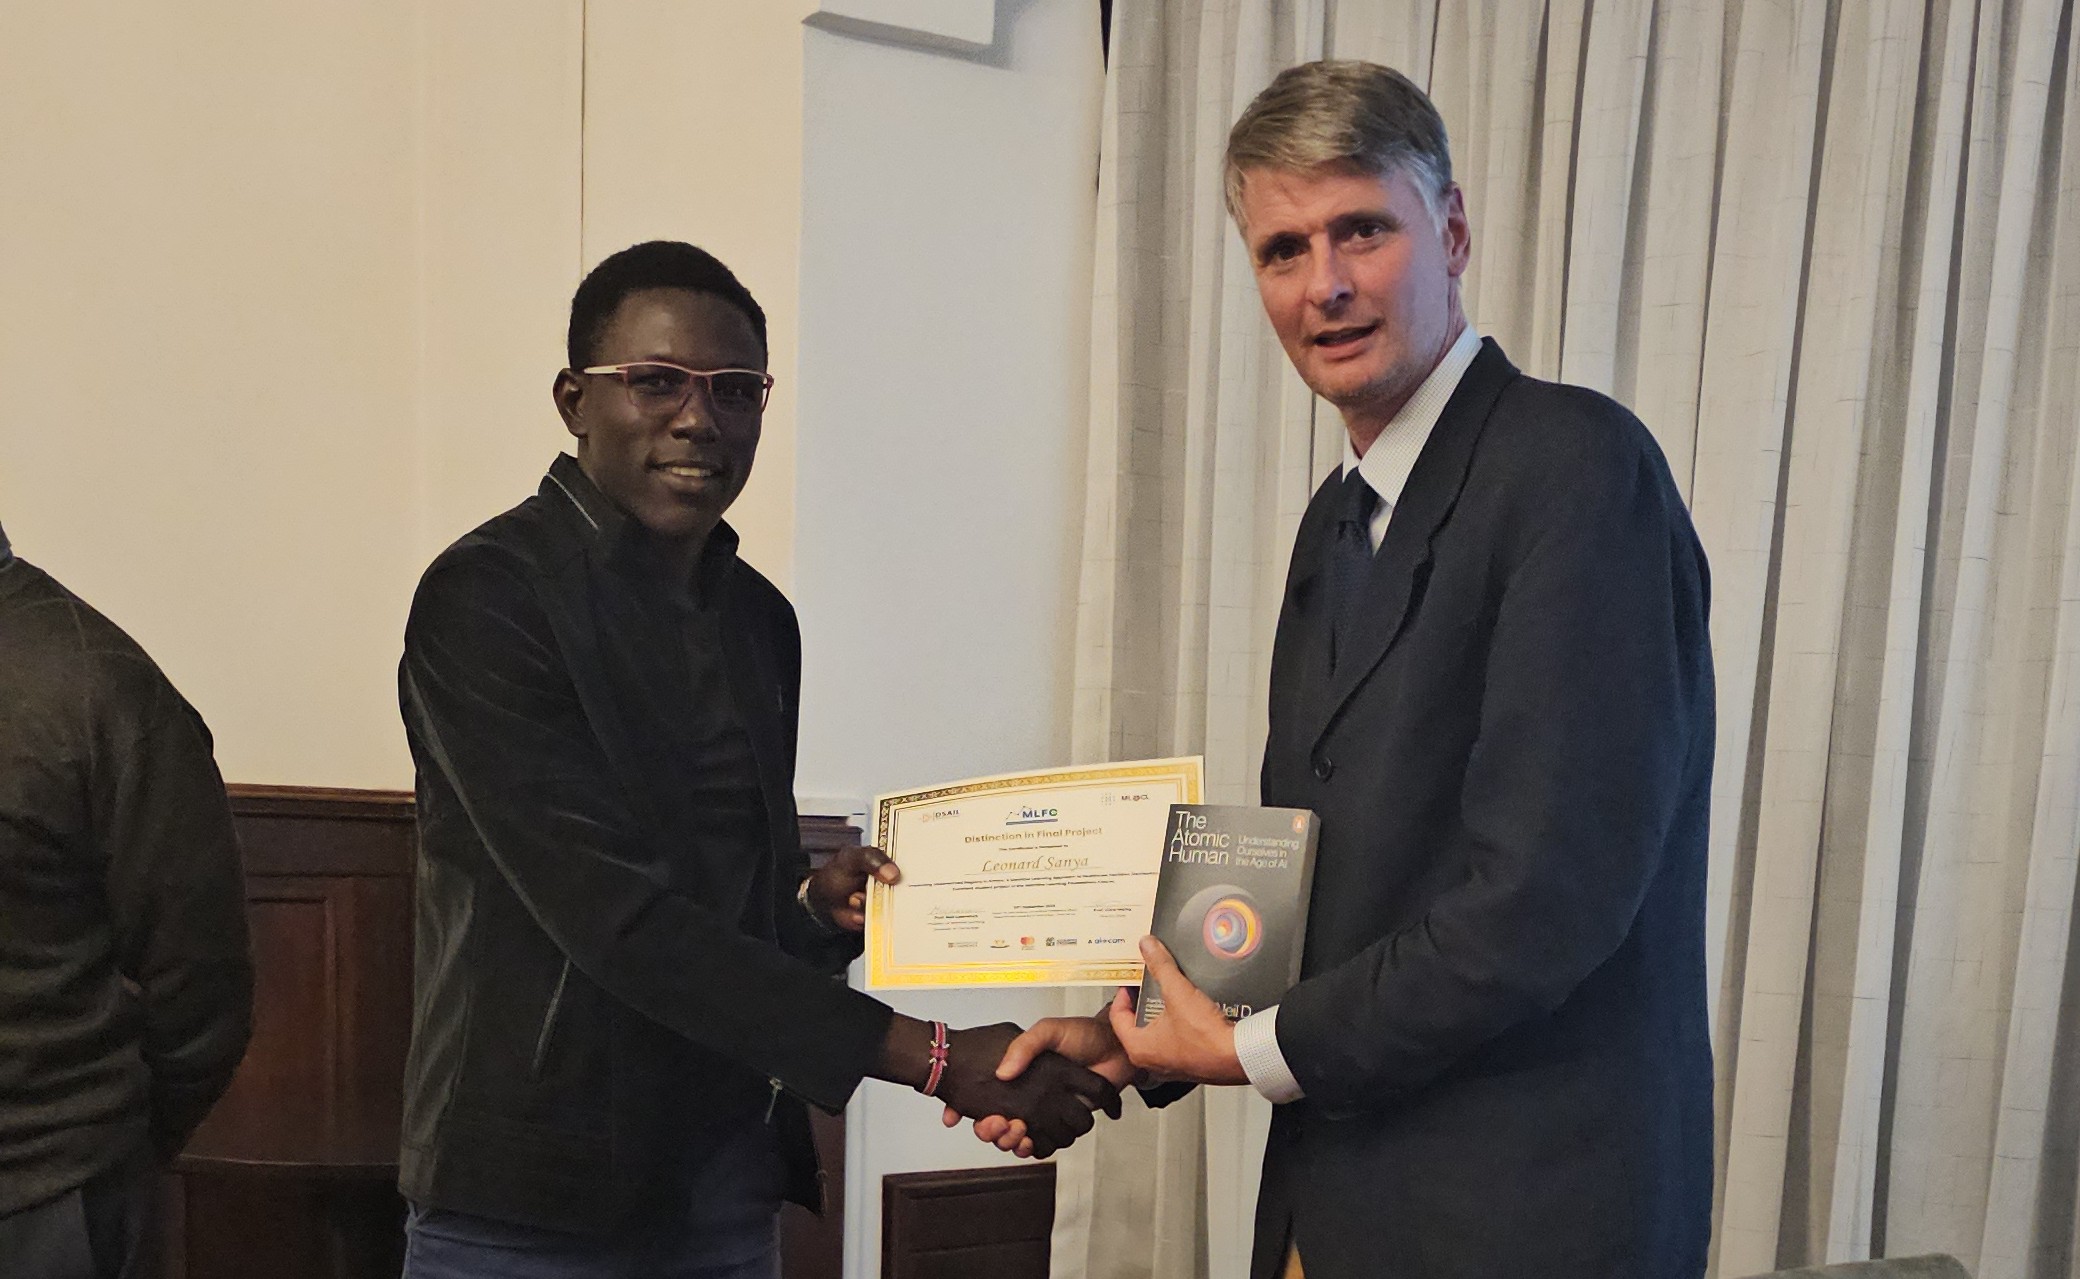
I’m truly honoured and grateful to have been awarded the Distinction in Final Project prize, a meaningful recognition of the effort and passion I put into my work.