
Abstract
In this lab session we will explore geospatial data using OpenStreetMap, create reusable code for data science pipelines, and apply machine learning to classify locations based on geographic features.
Geospatial Data and Machine Learning
OSMnx Setup
We start by installing some Python packages. We’ll use OSMnx, a Python package that makes it easy to download, model, analyze, and visualize street networks and other spatial data from OpenStreetMap.
%%capture
%pip install osmnx
import osmnx as ox
import matplotlib.pyplot as plt
import warnings
import math
warnings.filterwarnings("ignore", category=FutureWarning, module='osmnx')OSMnx provides a powerful interface to OpenStreetMap data, allowing us to programmatically access geographic information that would otherwise require manual browsing of the OpenStreetMap website.
https://www.openstreetmap.org/search?query=nyeri
Geospatial Data
In data science and machine learning geospatial data is particularly common and important. Location is the most shared between datasets. Many good example datasets, and easy to contextualise and visualise.
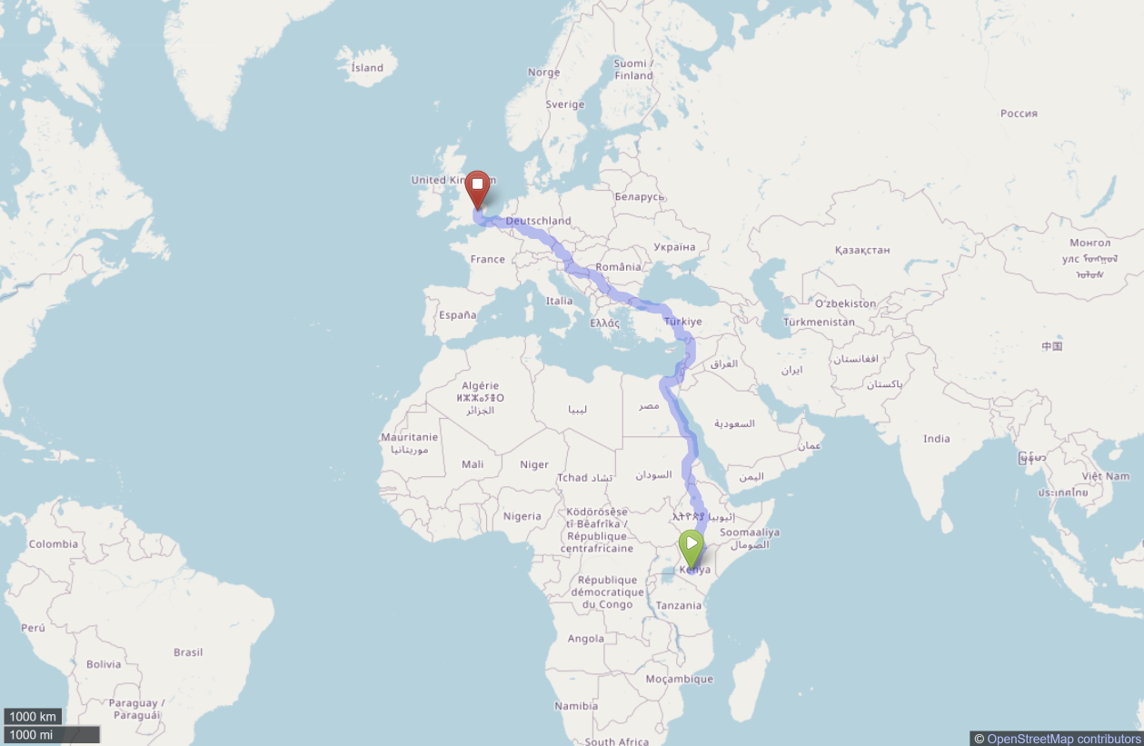
Open Street Maps (OSM) is an open geographic database that can provide useful information about different locations and places on the planet. In this example, we will download data about Nyeri, Kenya and compare it with Cambridge, England.
Geospatial data provides rich information about the world around us. It can help us understand patterns in urban development, economic activity, cultural differences, and infrastructure distribution. By analyzing features like amenities, buildings, and points of interest, we can build machine learning models that capture the essence of different places.
OpenStreetMap Data
We will download data of Nyeri, Kenya, which has the following latitude and longitude.
place_name = "Nyeri, Kenya"
latitude = -0.4371
longitude = 36.9580
placestub = place_name.lower().replace(' ', '-').replace(',','')
We’ll create a bounding box which is 0.02 degrees wide, 1 degree is around 111km (circumference of the Earth is around 40,000 km and 40,000/360=111km). Note: will this approximation work well in all countries?
box_width = 0.1 # About 11 km
box_height = 0.1
north = latitude + box_height/2
south = latitude - box_height/2
west = longitude - box_width/2
east = longitude + box_width/2
bbox = (west, south, east, north)
This bounding box defines the geographic area we want to analyze. The choice of size is important - too small and we miss important context, too large and we may include irrelevant features or face performance issues.
Downloading and Visualizing Geospatial Data
Points of Interest Extraction
Now we’ll download a set of points of interest from OpenStreetMap. We can specify the points of interest we’re interested in by building a small dictionary containing their labels as follows. A Point of Interest is a location with certain importance in the geographic area. They can vary from amenities to touristic places as you can see in the following.
# Retrieve POIs
tags = {
    "amenity": True,
    "buildings": True,
    "historic": True,
    "leisure": True,
    "shop": True,
    "tourism": True,
    "religion": True,
    "memorial": True
}
We can use osmnx to download all such points of interest within a given bounding box.
pois = ox.features_from_bbox(bbox, tags)That operation can take some time, particularly as the bounding box grows larger. Once it is complete we can check how many points of interest we have found, and examine their contents in more detail.
print(len(pois))
pois.head()
We notice a few things:
Points of interest do not have a consistent OpenStreetMap element_type, some are
node, others arerelationand we also haveway. You can find out more about elements in OpenStreetMap on this wiki page. This will become important when tidying up the data for next stage processing.Many of the values are missing. In SQL we would express a missing value as NULL. But in pandas a missing value is expressed as not-a-number, NaN. This is quite a common standard, but it is not the only standard. Sometimes data is collected and coded with an “unreasonable” value for a missing value. For example, someone might set missing values for heights to -999. The concept is that this is an obviously void “height” and would trigger a human user to check whether it’s a missing value. Of course, this is obvious to humans, but not necessarily to a computer!
Nodes, ways and relations in OpenStreetMap all have different keys associated with them. The data is not structured in standard database columns. Different points of interest might have different keys present or absent.
Visualizing Geographic Data
This gives us the relevant points of interest (part of the map). If we’d like to see the entire street network, we can download the entire graph from the location.
# Get graph from location
graph = ox.graph_from_bbox(bbox)
# City area
area = ox.geocode_to_gdf(place_name)
# Street network
nodes, edges = ox.graph_to_gdfs(graph)
# Buildings
buildings = ox.features_from_bbox(bbox, tags={"building": True})
Which we can then render as follows.
Sanity check. Head over to https://www.openstreetmap.org/#map=14/-0.43710/36.95800 and compare your map against the real thing.
This visualization provides a comprehensive view of the urban landscape, showing the relationship between different geographic features. The combination of street networks, buildings, and points of interest gives us insight into the structure and character of the place.
Features for Machine Learning
We have the POI information on all tourist places structured in a geodataframe. To work with them in a machine learning algorithm, it will be easier to convert them to a pandas DataFrame.
import pandas as pdpois_df = pd.DataFrame(pois)
pois_df['latitude'] = pois_df.apply(lambda row: row.geometry.centroid.y, axis=1)
pois_df['longitude'] = pois_df.apply(lambda row: row.geometry.centroid.x, axis=1)
tourist_places_df = pois_df[pois_df.tourism.notnull()]
print(len(tourist_places_df))
tourist_places_dfNow we can create a feature vector by counting different types of points of interest. This transforms the geographic data into numerical features that machine learning algorithms can work with.
poi_types = [
    ("amenity", None),
    ("amenity", "school"),
    ("amenity", "hospital"),
    ("amenity", "restaurant"),
    ("amenity", "cafe"),
    ("shop", None),
    ("tourism", None),
    ("tourism", "hotel"),
    ("tourism", "museum"),
    ("leisure", None),
    ("leisure", "park"),
    ("historic", None),
    ("amenity", "place_of_worship"),
]

poi_counts = {}

for key, value in poi_types:
    if key in pois_df.columns:
        if value:  # count only that value
            poi_counts[f"{key}:{value}"] = (pois_df[key] == value).sum()
        else:  # count any non-null entry
            poi_counts[key] = pois_df[key].notnull().sum()
    else:
        poi_counts[f"{key}:{value}" if value else key] = 0

poi_counts_df = pd.DataFrame(list(poi_counts.items()), columns=["POI Type", "Count"])
poi_counts_df # feature vector
This creates a feature vector that represents the characteristics of a place through the count of different amenities and points of interest. Such features can capture the economic, cultural, and social aspects of different locations.
Exercise 1
Use the code above to write a function, that given a set of coordinates, outputs a feature vector.
You will want it to query the area around the following cities.
cities_kenya = {
    "Nyeri, Kenya": {"latitude": -0.4371, "longitude": 36.9580},
    "Nairobi, Kenya": {"latitude": -1.2921, "longitude": 36.8219},
    "Mombasa, Kenya": {"latitude": -4.0435, "longitude": 39.6682},
    "Kisumu, Kenya": {"latitude": -0.0917, "longitude": 34.7680}
}

cities_england = {
    "Cambridge, England": {"latitude": 52.2053, "longitude": 0.1218},
    "London, England": {"latitude": 51.5072, "longitude": -0.1276},
    "Sheffield, England": {"latitude": 53.3811, "longitude": -1.4701},
    "Oxford, England": {"latitude": 51.7520, "longitude": -1.2577},
}
# TODO Write your function hereExercise 2
Here we will collect the feature vectors for all cities into one dataset. If you wrote the above code well, the following should just run - but do take a minute to understand what’s happening.
pd.set_option('future.no_silent_downcasting', True)def build_feature_dataframe(city_dicts, features, box_size_km=1):
results = {}
for country, cities in city_dicts:
for city, coords in cities.items():
vec = get_feature_vector(
coords["latitude"],
coords["longitude"],
box_size_km=box_size_km,
features=features
)
vec["country"] = country
results[city] = vec
return pd.DataFrame(results).T
df = build_feature_dataframe(city_dicts=[("Kenya", cities_kenya), ("England", cities_england)], features=features,box_size_km=1)
X = df.drop(columns="country").fillna(0)
y = df["country"]Dimensionality Reduction and Visualization
Dimensionality reduction is a technique used to take data with many features and compress it into a smaller set of new features that still capture most of the important patterns. It is not covered in this practical, but it is very useful for visualising complex datasets in two or three dimensions, making it easier to spot structure, clusters, or similarities between observations. We will use it to quickly visualise the feature vectors we have.
from sklearn.decomposition import PCApca = PCA(n_components=2)
X_proj = pca.fit_transform(X)
plt.figure(figsize=(8,6))
for country, color in [("Kenya", "green"), ("England", "blue")]:
mask = (y == country)
plt.scatter(X_proj[mask, 0], X_proj[mask, 1],
label=country, color=color, s=100, alpha=0.7)
for i, city in enumerate(df.index):
plt.text(X_proj[i,0]+0.02, X_proj[i,1], city, fontsize=8)
plt.xlabel("PC1")
plt.ylabel("PC2")
plt.title("2D projection of feature vectors")
plt.legend()
plt.show()The visual separation between Kenyan and English cities makes it clear that a machine learning approach should be successful in classifying areas as either Kenya or England based on features in the area.
Try a simple classification method of your choosing (eg. linear model) below, and report the results on the test set below:
from sklearn.linear_model import LogisticRegressionclf = LogisticRegression(max_iter=1000)
clf.fit(X, y)Testing on New Cities
cities_kenya_2 = {
    "Nakuru, Kenya": {"latitude": -0.3031, "longitude": 36.0800},
    "Eldoret, Kenya": {"latitude": 0.5143, "longitude": 35.2698},
    "Meru, Kenya": {"latitude": 0.0463,"longitude": 37.6559},
    "Kakamega, Kenya": {"latitude": 0.2827,"longitude": 34.7519}
}
cities_england_2 = {
    "Birmingham, England": {"latitude": 52.4862, "longitude": -1.8904},
    "Manchester, England": {"latitude": 53.4808, "longitude": -2.2426},
    "Leeds, England": {"latitude": 53.8008, "longitude": -1.5491},
    "Liverpool, England": {"latitude": 53.4084, "longitude": -2.9916}
}

df_test = build_feature_dataframe(city_dicts=[("Kenya", cities_kenya_2), ("England", cities_england_2)], features=features, box_size_km=1)

X_test = df_test.drop(columns="country").fillna(0)
y_test = df_test["country"]
# TODO: Classify your test set and report resultsThat probably worked!
Dataset Representativeness
But are we sure that we’re seperating for the right reasons? A brief look at the data above shows us that the England cities have a lot more OSM features in general, and that will probably be the line along which our algorithm will end up separating the data. Let’s validate on a very different set of English towns.
Make sure your code in Exercise 3 handles the case when no features are found!
cities_england_3 = {
    "Corbridge, England": {"latitude": 54.9740, "longitude": -2.0180},
    "Hexworthy, England": {"latitude": 50.5400, "longitude": -3.8950},
    "Ruckland, England": {"latitude": 53.3000, "longitude": 0.0000},
    "Malmesbury, England": {"latitude": 51.5850, "longitude": -2.0980}
}

df_test_3 = build_feature_dataframe(city_dicts=[ ("England", cities_england_3)], features=features,box_size_km=1)

X_test_3 = df_test_3.drop(columns="country").fillna(0)
y_test_3 = df_test_3["country"]
y_pred_3 = clf.predict(X_test_3)
pd.Series(y_pred_3, index=X_test_3.index)
What happens when we test on small English towns? This reveals an important issue in machine learning: dataset representativeness. Our model may be learning to distinguish between large, well-documented cities in Kenya versus large, well-documented cities in England, rather than learning the true cultural and geographic differences between the countries.
Exercise 3
Based on what you found above, discuss what makes a dataset representative. What other aspects of the analysis could we improve on? Come up with a better set of English and Kenyan places to include in your training data, and improve on the analysis above to find real differences between these places as seen through openstreetmaps.
Consider the following questions:
- Sampling bias: Are we comparing like with like? Large cities vs. small towns?
- Feature selection: Are we using features that reflect genuine cultural/geographic differences?
- Data availability: Does OpenStreetMap have equal coverage in both countries?
- Urban vs. rural: Should we control for population size or urban development level?
- **conomic factors*: Are we inadvertently learning to distinguish economic development levels?
# TODO: discusscities_england_new = {} # TODO
cities_kenya_new = {} # TODO
features_new = [] # TODO
df_test_3a = build_feature_dataframe(city_dicts=[ ("England", cities_england_3)], features=features,box_size_km=1)
X_test_3a = df_test_3a.drop(columns="country").fillna(0)
# y_test_3a = df_test_3a["country"]
df_new = build_feature_dataframe(city_dicts=[("Kenya", cities_kenya_new), ("England", cities_england_new)], features=features_new,box_size_km=1)
X_new = df_new.drop(columns="country").fillna(0)
y_new = df_new["country"]
clf = LogisticRegression(max_iter=1000)
clf.fit(X_new, y_new)
y_pred_new = clf.predict(X_test_3a)
pd.Series(y_pred_new, index=X_test_3a.index)A representative dataset requires careful consideration of sampling strategy, ensuring that we capture the true diversity within each class while controlling for confounding variables that might lead to spurious correlations.
Access, Assess, Address Framework
The Access-Assess-Address framework provides a systematic approach to data science projects:
- Access: How do we get the data? This includes APIs, web scraping, database queries, file formats, etc.
- Assess: How do we evaluate data quality, understand its structure, and validate our assumptions?
- Address: How do we answer the specific question or solve the problem at hand?
Applying the Framework
Using the lessons from the article, have a look at the functionality you created, and identify generalisable Access, Assess and Address functionality that could come in useful in the future.
Access functionality
What we’ve created: - Connection to OpenStreetMap API via OSMnx
What we might need to have done: - Legal, ethical considerations.
Assess functionality
What we’ve created: - plot_city_map(): visualizes OSM data for any location - get_feature_vector(): Extracts quantitative features from geographic coordinates - Visualization of geographic data to understand structure - Feature counting and summarization - Dimensionality reduction for pattern visualization
What we could create - Data quality checks (handling missing data, failed queries)
Address functionality
What we’ve created: - Machine learning pipeline for location classification - Evaluation on test sets - Analysis of model performance and potential biases}
Library
Consider for example, this reusable library structure:
# access.py

def get_osm_datapoints(latitude, longitude, box_size_km=2, poi_tags=None):
    # Example function for getting OSM data
    pass

# assess.py
def plot_city_map(place_name, latitude, longitude, box_size_km=2, poi_tags=None):
    # Access and visualize geographic data
    pass

def get_osm_features(latitude, longitude, box_size_km=2, tags=None):
    # Access raw OSM data
    pass

def get_feature_vector(latitude, longitude, box_size_km=2, features=None):
    # Assess and quantify geographic features
    pass

def visualize_feature_space(X, y, method='PCA'):
    # Assess data distribution and separability
    pass

# address.py
def train_location_classifier(X_train, y_train, model_type='logistic'):
    # Address classification problem
    pass

def evaluate_classifier(model, X_test, y_test):
    # Address evaluation of performance
    pass
Exercise 4
Over the course of this module we will end up reusing a lot of the code we create. This is on purpose, and a very important aspect of creating data science pipelines. The goal of this section is to put this idea in practice.
Have a skim through Neil Lawrence’s article on the Access Assess Address data science framework here.
Using the lessons from the article, have a look at the functionality you created, and identify generalisable Access, Assess and Address functionality that could come in useful in the future.
Use git to fork this repository: https://github.com/lawrennd/fynesse_template and include your code in the access.py, assess.py, and address.py files.
Demonstrate this by importing your repository below and calling a couple example functions.
This modular approach makes code reusable across different projects and enables systematic data science workflows. Each module has a clear responsibility within the overall pipeline.
Once you have implemented your functions you should be able to call them to plot the city map.
import fynessefynesse.assess.plot_city_map('Cambridge, England', 52.2053, 0.1218, 2)Bonus
If you made changes to the repository after pulling it, you might have issues getting the changes to take effect in the workbook without restarting runtime. Use the workaround below:
import os, subprocess, importlib, sys

def load_repo(repo):
    local = repo.split("/")[-1]
    if not os.path.exists(local):
        subprocess.run(["git", "clone", f"https://github.com/{repo}.git"], check=True)
    else:
        subprocess.run(["git", "-C", local, "pull"], check=True)
    if local not in sys.path:
        sys.path.insert(0, local)
    mod = importlib.import_module(local)
    importlib.reload(mod)
    return mod

# Use after making changes
fynesse = load_repo("TODO/fynesse_TODO")
End of Practical 1A
 _______  __   __  _______  __    _  ___   _  _______  __
|       ||  | |  ||   _   ||  |  | ||   | | ||       ||  |
|_     _||  |_|  ||  |_|  ||   |_| ||   |_| ||  _____||  |
  |   |  |       ||       ||       ||      _|| |_____ |  |
  |   |  |       ||       ||  _    ||     |_ |_____  ||__|
  |   |  |   _   ||   _   || | |   ||    _  | _____| | __
  |___|  |__| |__||__| |__||_|  |__||___| |_||_______||__|
Thanks!
For more information on these subjects and more you might want to check the following resources.
- company: Trent AI
- book: The Atomic Human
- twitter: @lawrennd
- podcast: The Talking Machines
- newspaper: Guardian Profile Page
- blog: http://inverseprobability.com