Data Quality and Data Readiness Levels
The Gartner Hype Cycle
Cycle for ML Terms
Google Trends
Machine Learning
\[ \text{data} + \text{model} \stackrel{\text{compute}}{\rightarrow} \text{prediction} \]
Code and Data Separation
- Classical computer science separates code and data.
- Machine learning short-circuits this separation.
Example: Supply Chain
Electricity
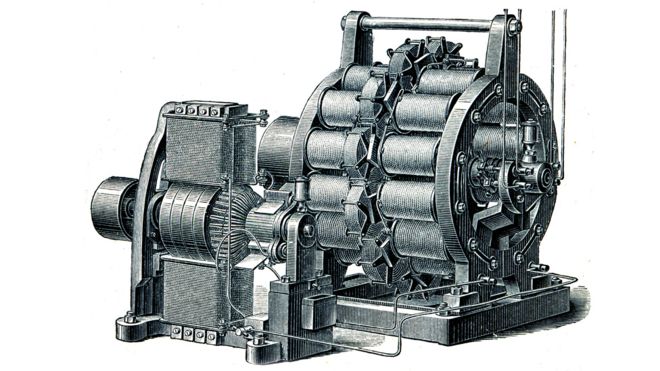
Why didn’t electricity immediately change manufacturing? by Tim Harford
The Physical World: Where Bits meet Atoms
The change from atoms to bits is irrevocable and unstoppable. Why now? Because the change is also exponential — small differences of yesterday can have suddenly shocking consequences tomorrow.
Nicholas Negroponte, Being Digital 1995
The Gap
- There is a gap between the world of data science and AI.
- The mapping of the virtual onto the physical world.
- E.g. Causal understanding.
Supply Chain

Cromford


Deep Freeze

Deep Freeze

Machine Learning in Supply Chain
- Supply chain: Large Automated Decision Making Network
- Major Challenge:
- We have a mechanistic understanding of supply chain.
- Machine learning is a data driven technology.
Bits and Atoms: Information Meets Goods

Data Science Africa is a bottom up initiative for capacity building in data science, machine learning and AI on the African continent
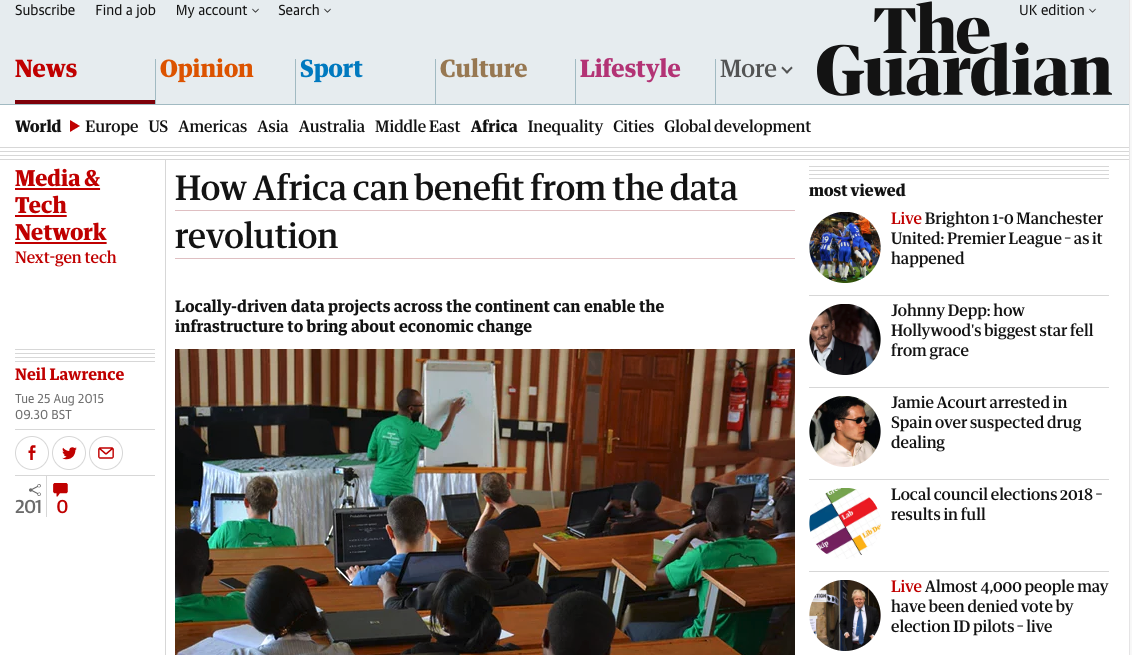
Crop Monitoring
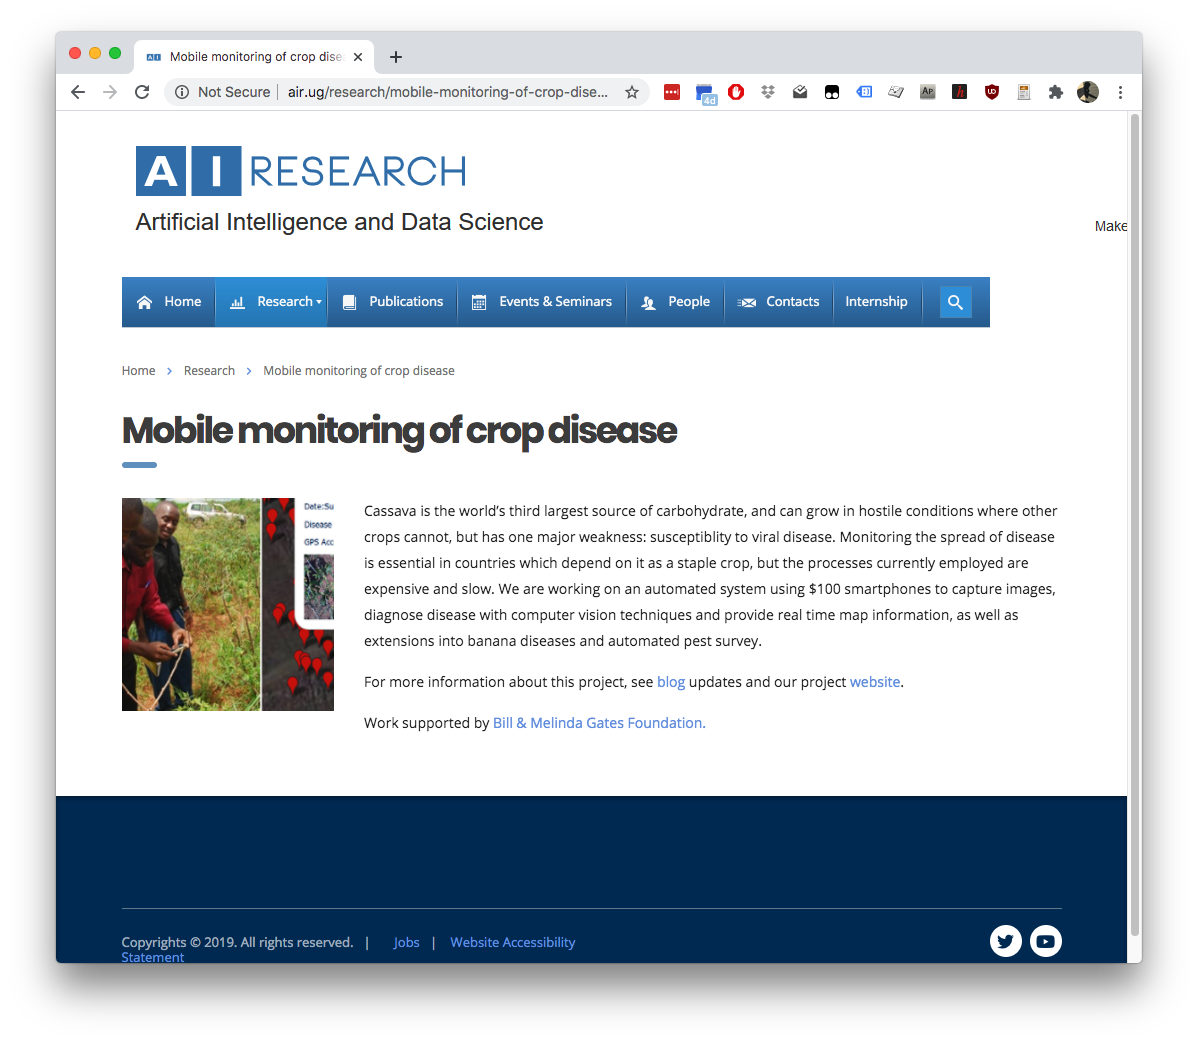
Biosurveillance

Community Radio

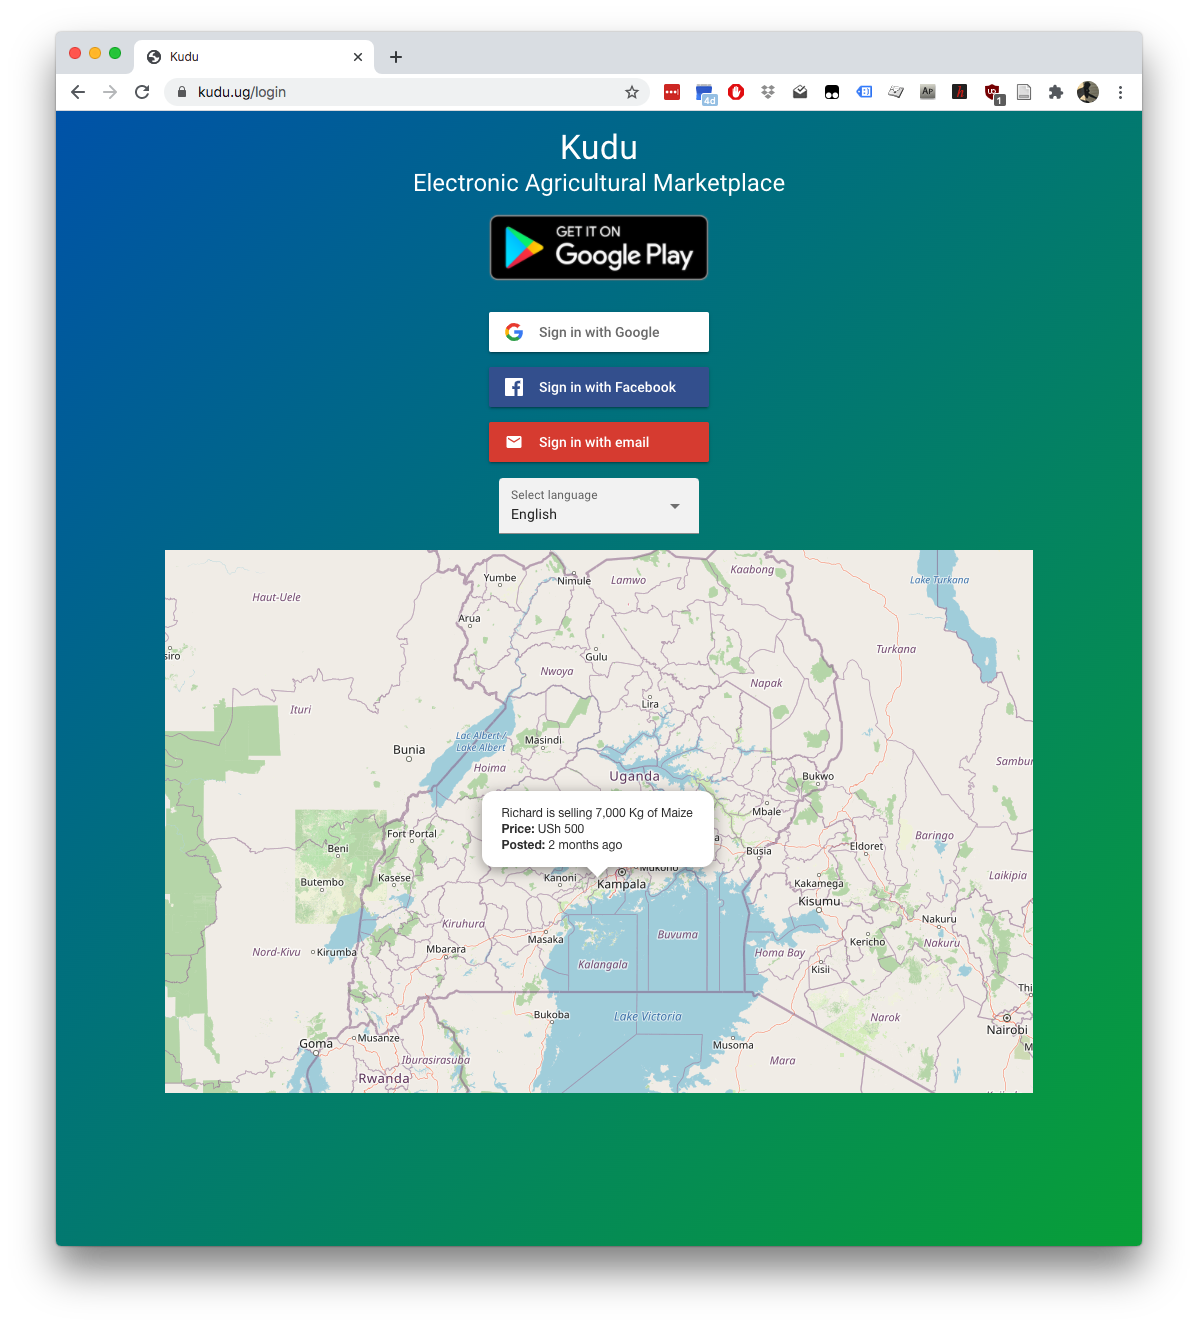
Kudu Project
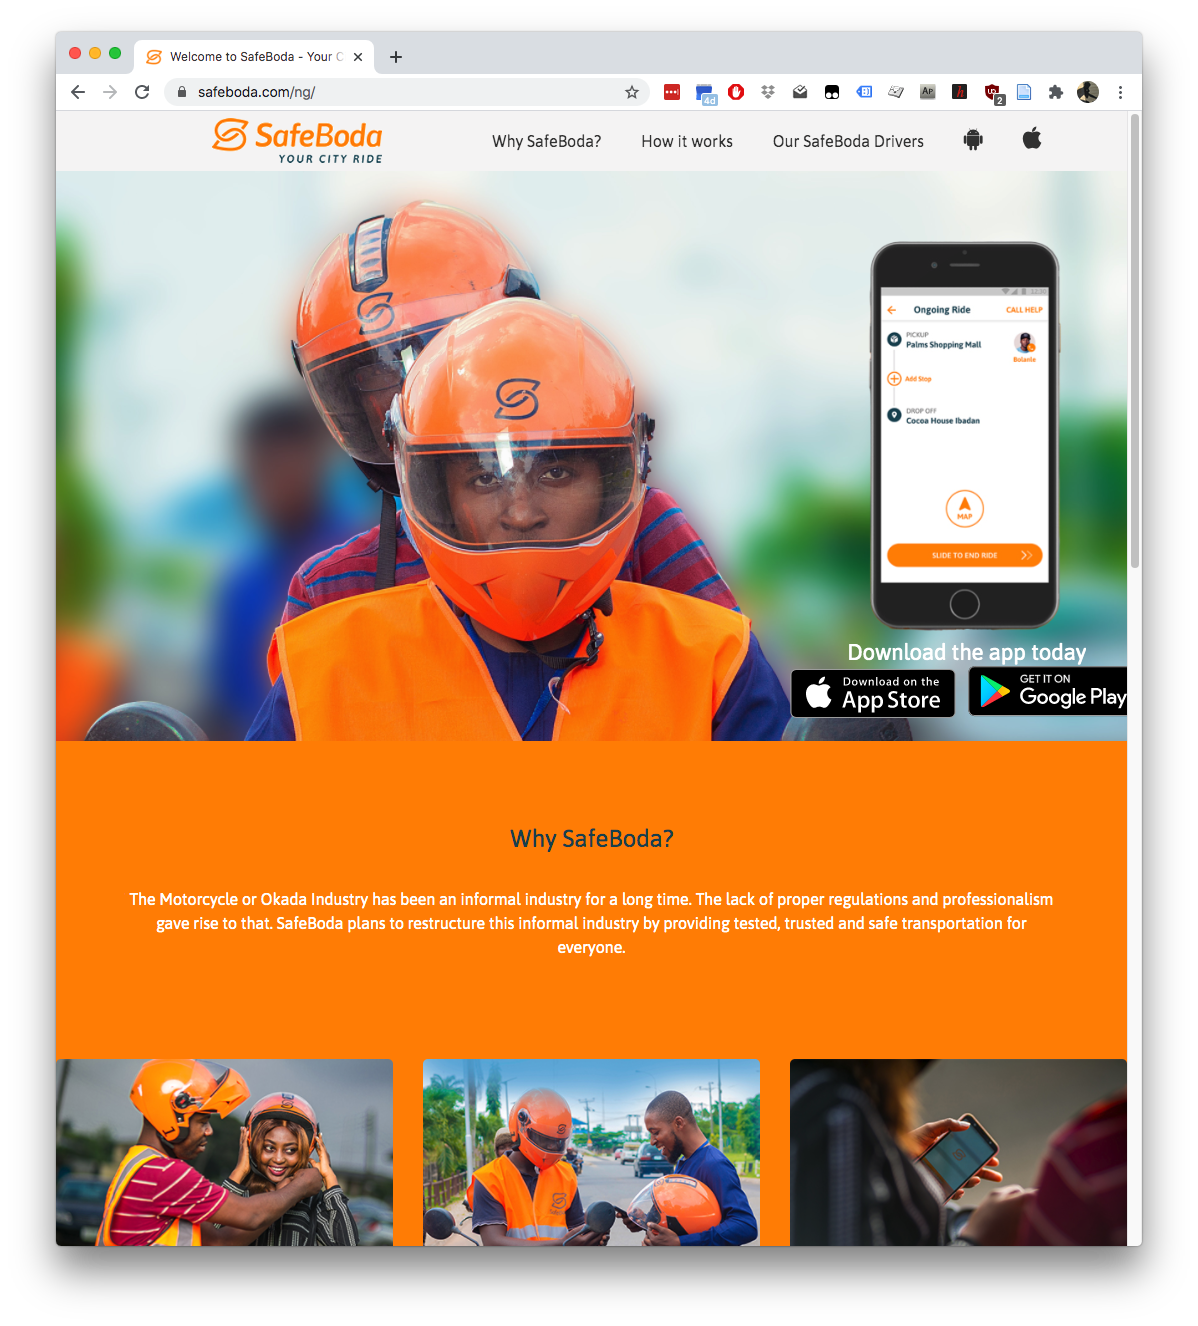
Safe Boda
Experiment, Analyze, Design
A Vision
We don’t know what science we’ll want to do in five years’ time, but we won’t want slower experiments, we won’t want more expensive experiments and we won’t want a narrower selection of experiments.
What do we want?
- Faster, cheaper and more diverse experiments.
- Better ecosystems for experimentation.
- Data oriented architectures.
- Data maturity assessments.
- Data readiness levels.
Objective
A two order of magnitude increase in number of experiments run on supply chain three years’ time.
The Tribal Mentality
- \(\text{data} + \text{model}\) is
not new.
- Dates back to Newton, Laplace, Gauss
- Plethora of fields: E.g.
- Operations Research
- Control
- Econometrics
- Statistics
- Machine learning
- Data science
The Tribal Mentality
- This can lead to confusion:
- Different academic fields are:
- Born in different eras
- Driven by different motivations
- Arrive at different solutions
- Different academic fields are:
Tribalism Can be Good
- Allows for consensus on best practice.
- Shared set of goals
- Ease of commiunication
- Rapid deployment of robust solutions
Professional Tribes
- This is the nature of professions
- lawyers
- medics
- doctors
- engineers
- accountants
Different Views
\[\text{data} + \text{model}\]
- For OR, control, stats etc.
- More things unite us rather than divide us.
We’re no longer hunter gatherers …
- The automation challenges we face require
- all of our best ideas.
- rethinking what \(\text{data}+\text{model}\) means
- rapid deployment and continuous monitoring
- This is the era of data science
Discomfort and Disconformation
- Talking across field boundaries is critical.
- It helps us disconfirm our beliefs.
- It’s not comfortable, but it’s vital.
Data Readiness Levels
Data Readiness Levels
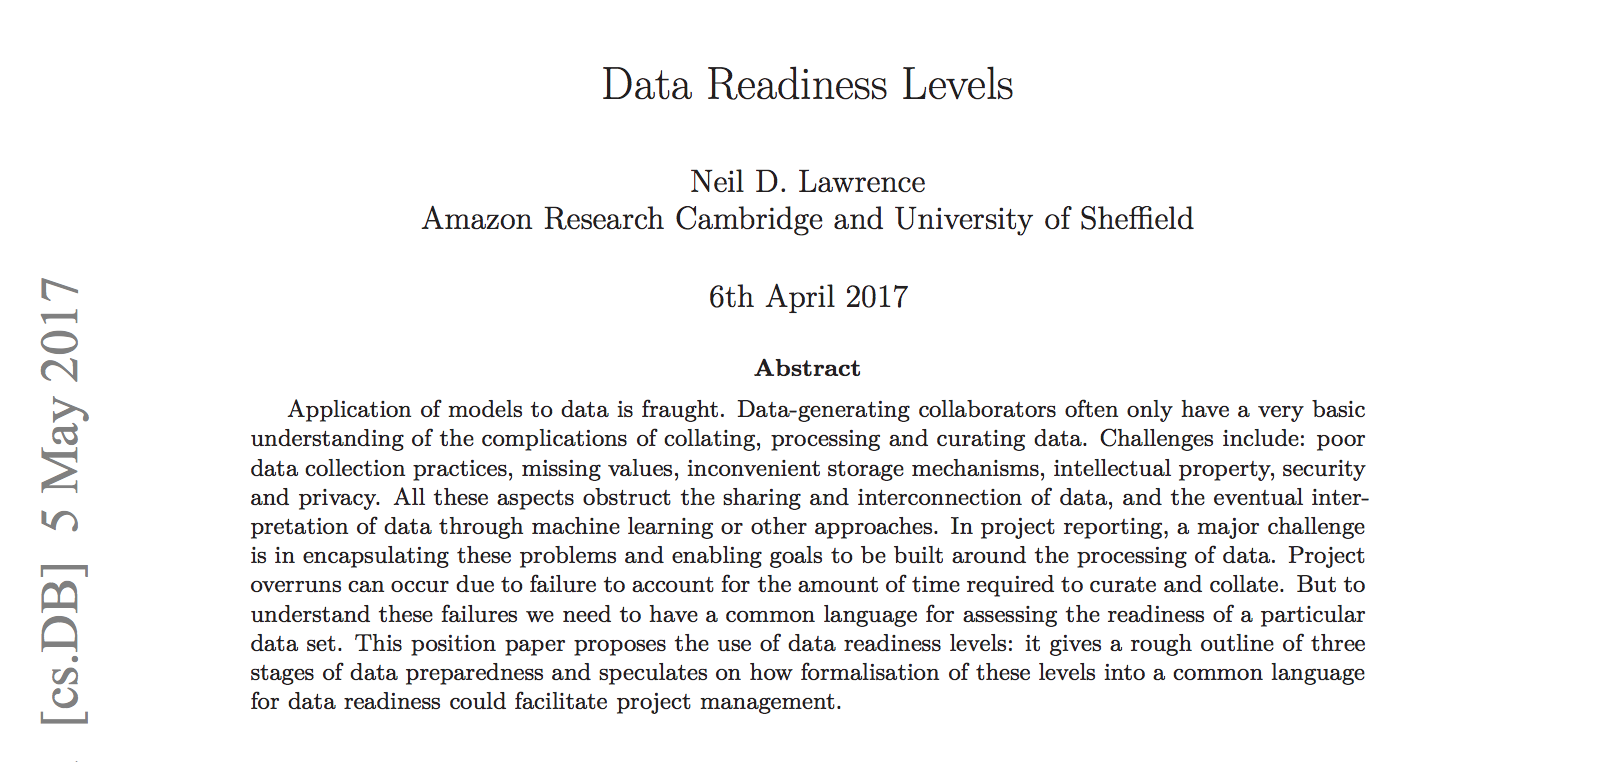
https://arxiv.org/pdf/1705.02245.pdf Data Readiness Levels (Lawrence, 2017)
Three Grades of Data Readiness
- Grade C - accessibility
- Transition: data becomes electronically available
- Grade B - validity
- Transition: pose a question to the data.
- Grade A - usability
Accessibility: Grade C
- Hearsay data.
- Availability, is it actually being recorded?
- privacy or legal constraints on the accessibility of the recorded data, have ethical constraints been alleviated?
- Format: log books, PDF …
- limitations on access due to topology (e.g. it’s distributed across a number of devices)
- At the end of Grade C data is ready to be loaded into analysis software (R, SPSS, Matlab, Python, Mathematica)
Validity: Grade B
- faithfulness and representation
- visualisations.
- exploratory data analysis
- noise characterisation.
Grade B Checks
- Missing values.
- Schema alignment, record linkage, data fusion
- Example:
- Was a column or columns accidentally perturbed (e.g. through a sort operation that missed one or more columns)? Or was a gene name accidentally converted to a date?
Grade B Transition
- At the end of Grade B, ready to define a task, or question
- Compare with classical statistics:
- Classically: question is first data comes later.
- Today: data is first question comes later.
Data First
In a data first company teams own their data quality issues at least as far as grade B1.
Usability: Grade A
- The usability of data
- Grade A is about data in context.
- Consider appropriateness of a given data set to answer a particular question or to be subject to a particular analysis.
Recursive Effects
- Grade A may also require:
- data integration
- active collection of new data.
- rebalancing of data to ensure fairness
- annotation of data by human experts
- revisiting the collection (and running through the appropriate stages again)
A1 Data
- A1 data is ready to make available for challenges or AutoML platforms.
Contribute!
Also …
- Encourage greater interaction between application domains and data scientists
- Encourage visualization of data
Data Maturity Assessment
- Emerging from the DELIVE Initiatives Data Work (The DELVE Initiative, 2020)
- Recommendation for Data Maturity Assessments (Lawrence et al., 2020)
Characterising Data Maturity
1. Reactive
2. Repeatable
3. Managed and Integrated
4. Optimized
5. Transparent
Introduction
Conclusions
- Data is modern software
- We need to revisit software engineering and computer science in this context.
Thanks!
twitter: @lawrennd
podcast: The Talking Machines
Guardian article on How African can benefit from the data revolution
Guardian article on Data Science Africa
blog posts: