Intent, Incentives, and the Data Crisis
Intent, incentives, and the data crisis
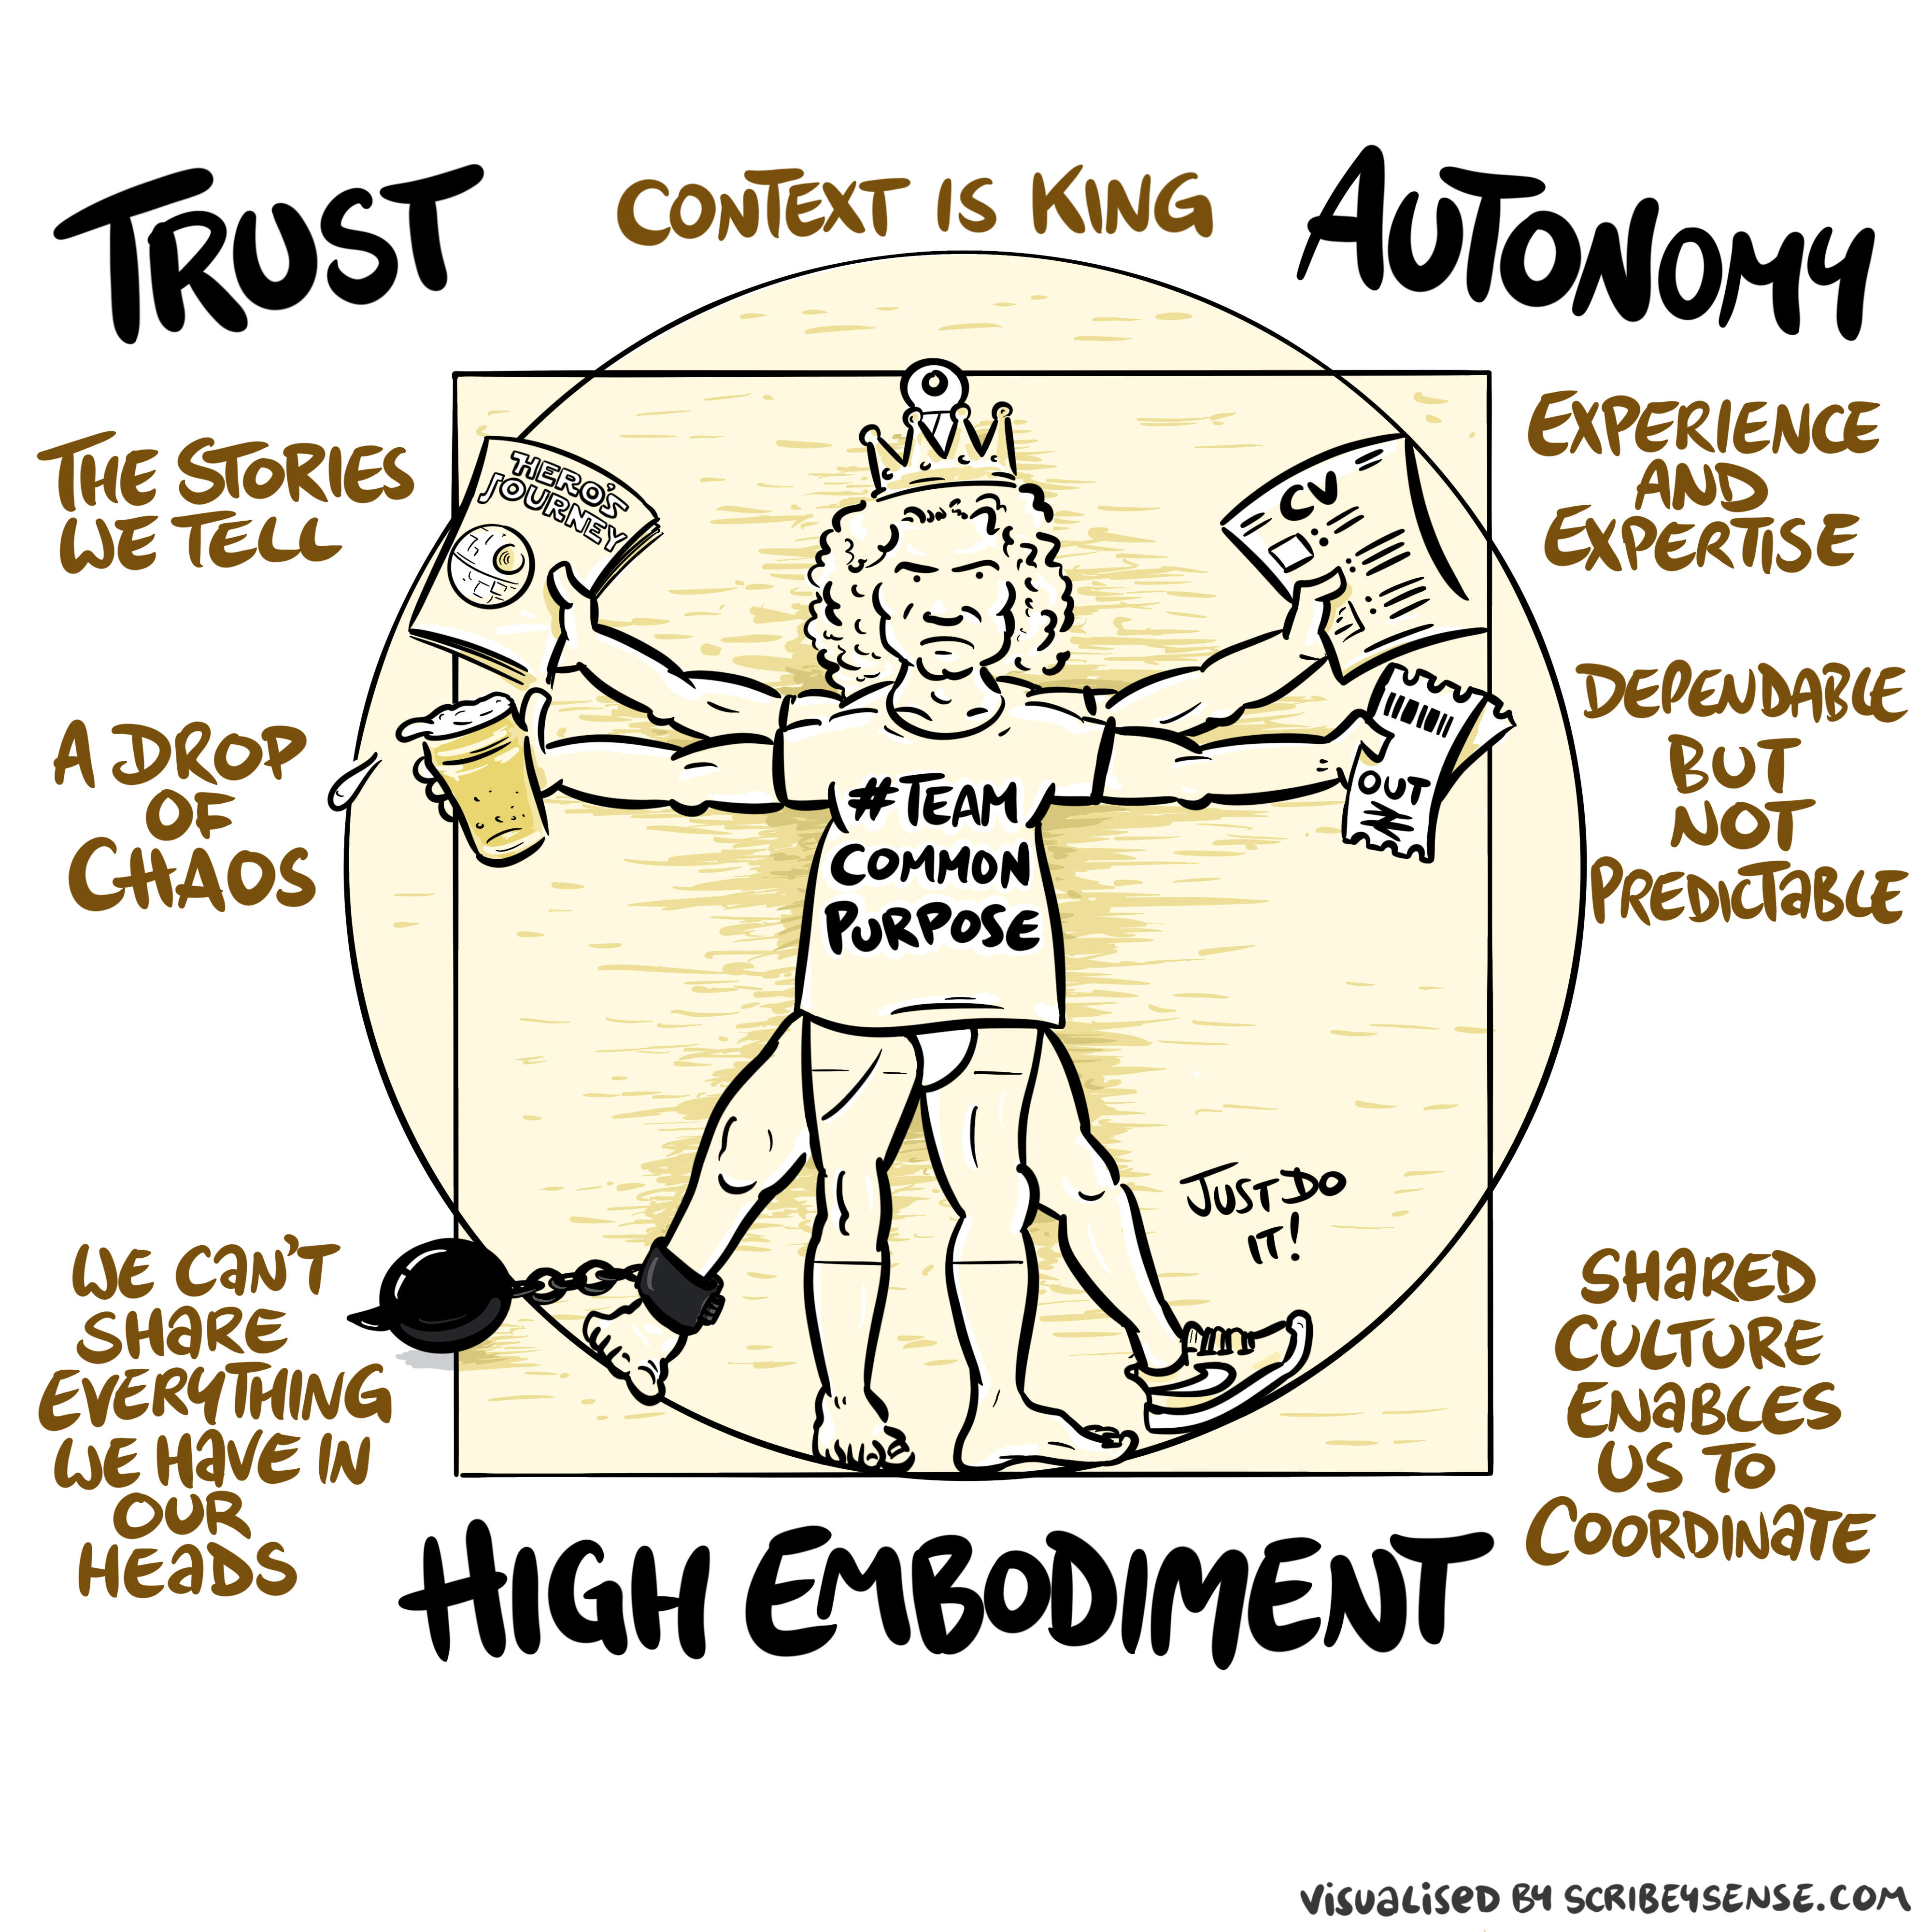
Trust, Autonomy and Embodiment
Executive framing
- Data isn’t an asset in isolation: it’s leverage over decisions.
- The crisis is rarely “dirty data” — it’s misaligned intent, hidden incentives, and unobserved failure at scale.
- Your default questions: what is the system optimising, who benefits, and who pays when it’s wrong?
The Attention Economy
Herbert Simon on Information
What information consumes is rather obvious: it consumes the attention of its recipients. Hence a wealth of information creates a poverty of attention …
Simon (1971)
How data-driven systems fail (at scale)
- Goodhart dynamics: when a measure becomes a target, it stops being a good measure.
- Gaming/adversaries: once the objective is learnable, it’s exploitable.
- Homogeneity risk: one ranking/decision rule becomes a society-wide single point of failure.
- Accountability gaps: “the model said so” is not a control system.
DRLs as instrumentation (not a checklist)
The Software Crisis
The major cause of the software crisis is that the machines have become several orders of magnitude more powerful! To put it quite bluntly: as long as there were no machines, programming was no problem at all; when we had a few weak computers, programming became a mild problem, and now we have gigantic computers, programming has become an equally gigantic problem.
Edsger Dijkstra (1930-2002), The Humble Programmer
The Data Crisis
The major cause of the data crisis is that machines have become more interconnected than ever before. Data access is therefore cheap, but data quality is often poor. What we need is cheap high-quality data. That implies that we develop processes for improving and verifying data quality that are efficient.
There would seem to be two ways for improving efficiency. Firstly, we should not duplicate work. Secondly, where possible we should automate work.
Me
There are three types of lies: lies, damned lies and statistics
??
There are three types of lies: lies, damned lies and statistics
Arthur Balfour 1848-1930
There are three types of lies: lies, damned lies and statistics
Arthur Balfour 1848-1930
There are three types of lies: lies, damned lies and ‘big data’
Neil Lawrence 1972-?
Mathematical Statistics

‘Mathematical Data Science’

Quantifying the Value of Data
Quantifying the Value of Data
There’s a sea of data, but most of it is undrinkable.

We require data-desalination before it can be consumed!
Data
- 90% of our time is spent on validation and integration (Leo Anthony Celi)
- “The Dirty Work We Don’t Want to Think About” (Eric Xing)
- “Voodoo to get it decompressed” (Francisco Giminez)
- In health care clinicians collect the data and often control the direction of research through guardianship of data.
Value
- How do we measure value in the data economy?
- How do we encourage data workers: curation and management
- Incentivization for sharing and production.
- Quantifying the value in the contribution of each actor.
Credit Allocation
Direct work on data generates an enormous amount of ‘value’ in the data economy but this is unaccounted in the economy
Hard because data is difficult to ‘embody’
Value of shared data: Wellcome Trust 2010 Joint Statement (from the “Foggy Bottom” meeting)
Data Readiness Levels
Data Readiness Levels
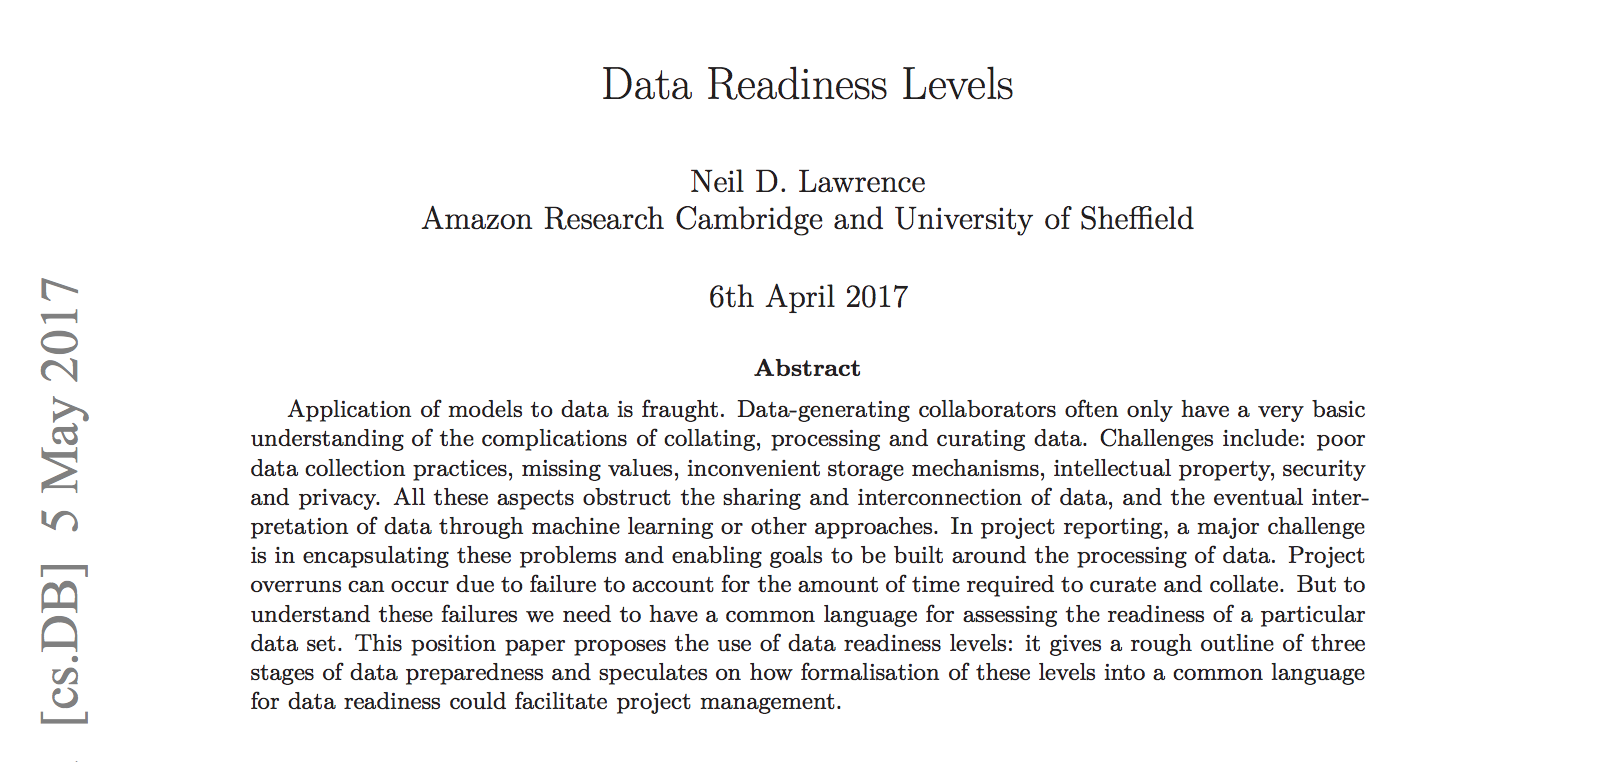
https://arxiv.org/pdf/1705.02245.pdf Data Readiness Levels (Lawrence, 2017)
Three Grades of Data Readiness
- Grade C - accessibility
- Transition: data becomes electronically available
- Grade B - validity
- Transition: pose a question to the data.
- Grade A - usability
Accessibility: Grade C
- Hearsay data.
- Availability, is it actually being recorded?
- privacy or legal constraints on the accessibility of the recorded data, have ethical constraints been alleviated?
- Format: log books, PDF …
- limitations on access due to topology (e.g. it’s distributed across a number of devices)
- At the end of Grade C data is ready to be loaded into analysis software (R, SPSS, Matlab, Python, Mathematica)
Validity: Grade B
- faithfulness and representation
- visualisations.
- exploratory data analysis
- noise characterisation.
Grade B Checks
- Missing values.
- Schema alignment, record linkage, data fusion
- Example:
- Was a column or columns accidentally perturbed (e.g. through a sort operation that missed one or more columns)? Or was a gene name accidentally converted to a date?
Grade B Transition
- At the end of Grade B, ready to define a task, or question
- Compare with classical statistics:
- Classically: question is first data comes later.
- Today: data is first question comes later.
Data First
In a data first company teams own their data quality issues at least as far as grade B1.
Usability: Grade A
- The usability of data
- Grade A is about data in context.
- Consider appropriateness of a given data set to answer a particular question or to be subject to a particular analysis.
Recursive Effects
- Grade A may also require:
- data integration
- active collection of new data.
- rebalancing of data to ensure fairness
- annotation of data by human experts
- revisiting the collection (and running through the appropriate stages again)
A1 Data
- A1 data is ready to make available for challenges or AutoML platforms.
Contribute!
Also …
- Encourage greater interaction between application domains and data scientists
- Encourage visualization of data
Assessing the Organizations Readiness
See Also …
- Data Joel Tests
Solutions
- Encourage greater interaction between application domains and data scientists
- Encourage visualization of data
- Adoption of ‘data readiness levels’
- Implications for incentivization schemes
Data Science as Debugging
- Analogies: For Software Engineers describe data science as debugging.
80/20 in Data Science
- Anecdotally for a given challenge
- 80% of time is spent on data wrangling.
- 20% of time spent on modelling.
- Many companies employ ML Engineers focussing on models not data.
Lessons
- When you begin an analysis behave as a debugger
- Write test code as you go.
- document tests … make them accessible.
- Be constantly skeptical.
- Develop deep understanding of best tools.
- Share your experience of challenges, have others review work
Lessons
- When managing a data science process.
- Don’t deploy standard agile development. Explore modifications e.g. Kanban
- Don’t leave data scientist alone to wade through mess.
- Integrate the data analysis with other team activities
- Have software engineers and domain experts work closely with data scientists
Access / Assess / Address (make DRLs operational)
- Access (DRL-C): can we legally/ethically/technically get the data?
- Assess (DRL-B): what can we learn about the data before the downstream question?
- Address (DRL-A): what is decision-specific (context, thresholds, deployment)?
Background: Big Data
Data is Pervasive phenomenon that affects all aspects of our activities
Data diffusiveness is both a challenge and an opportunity
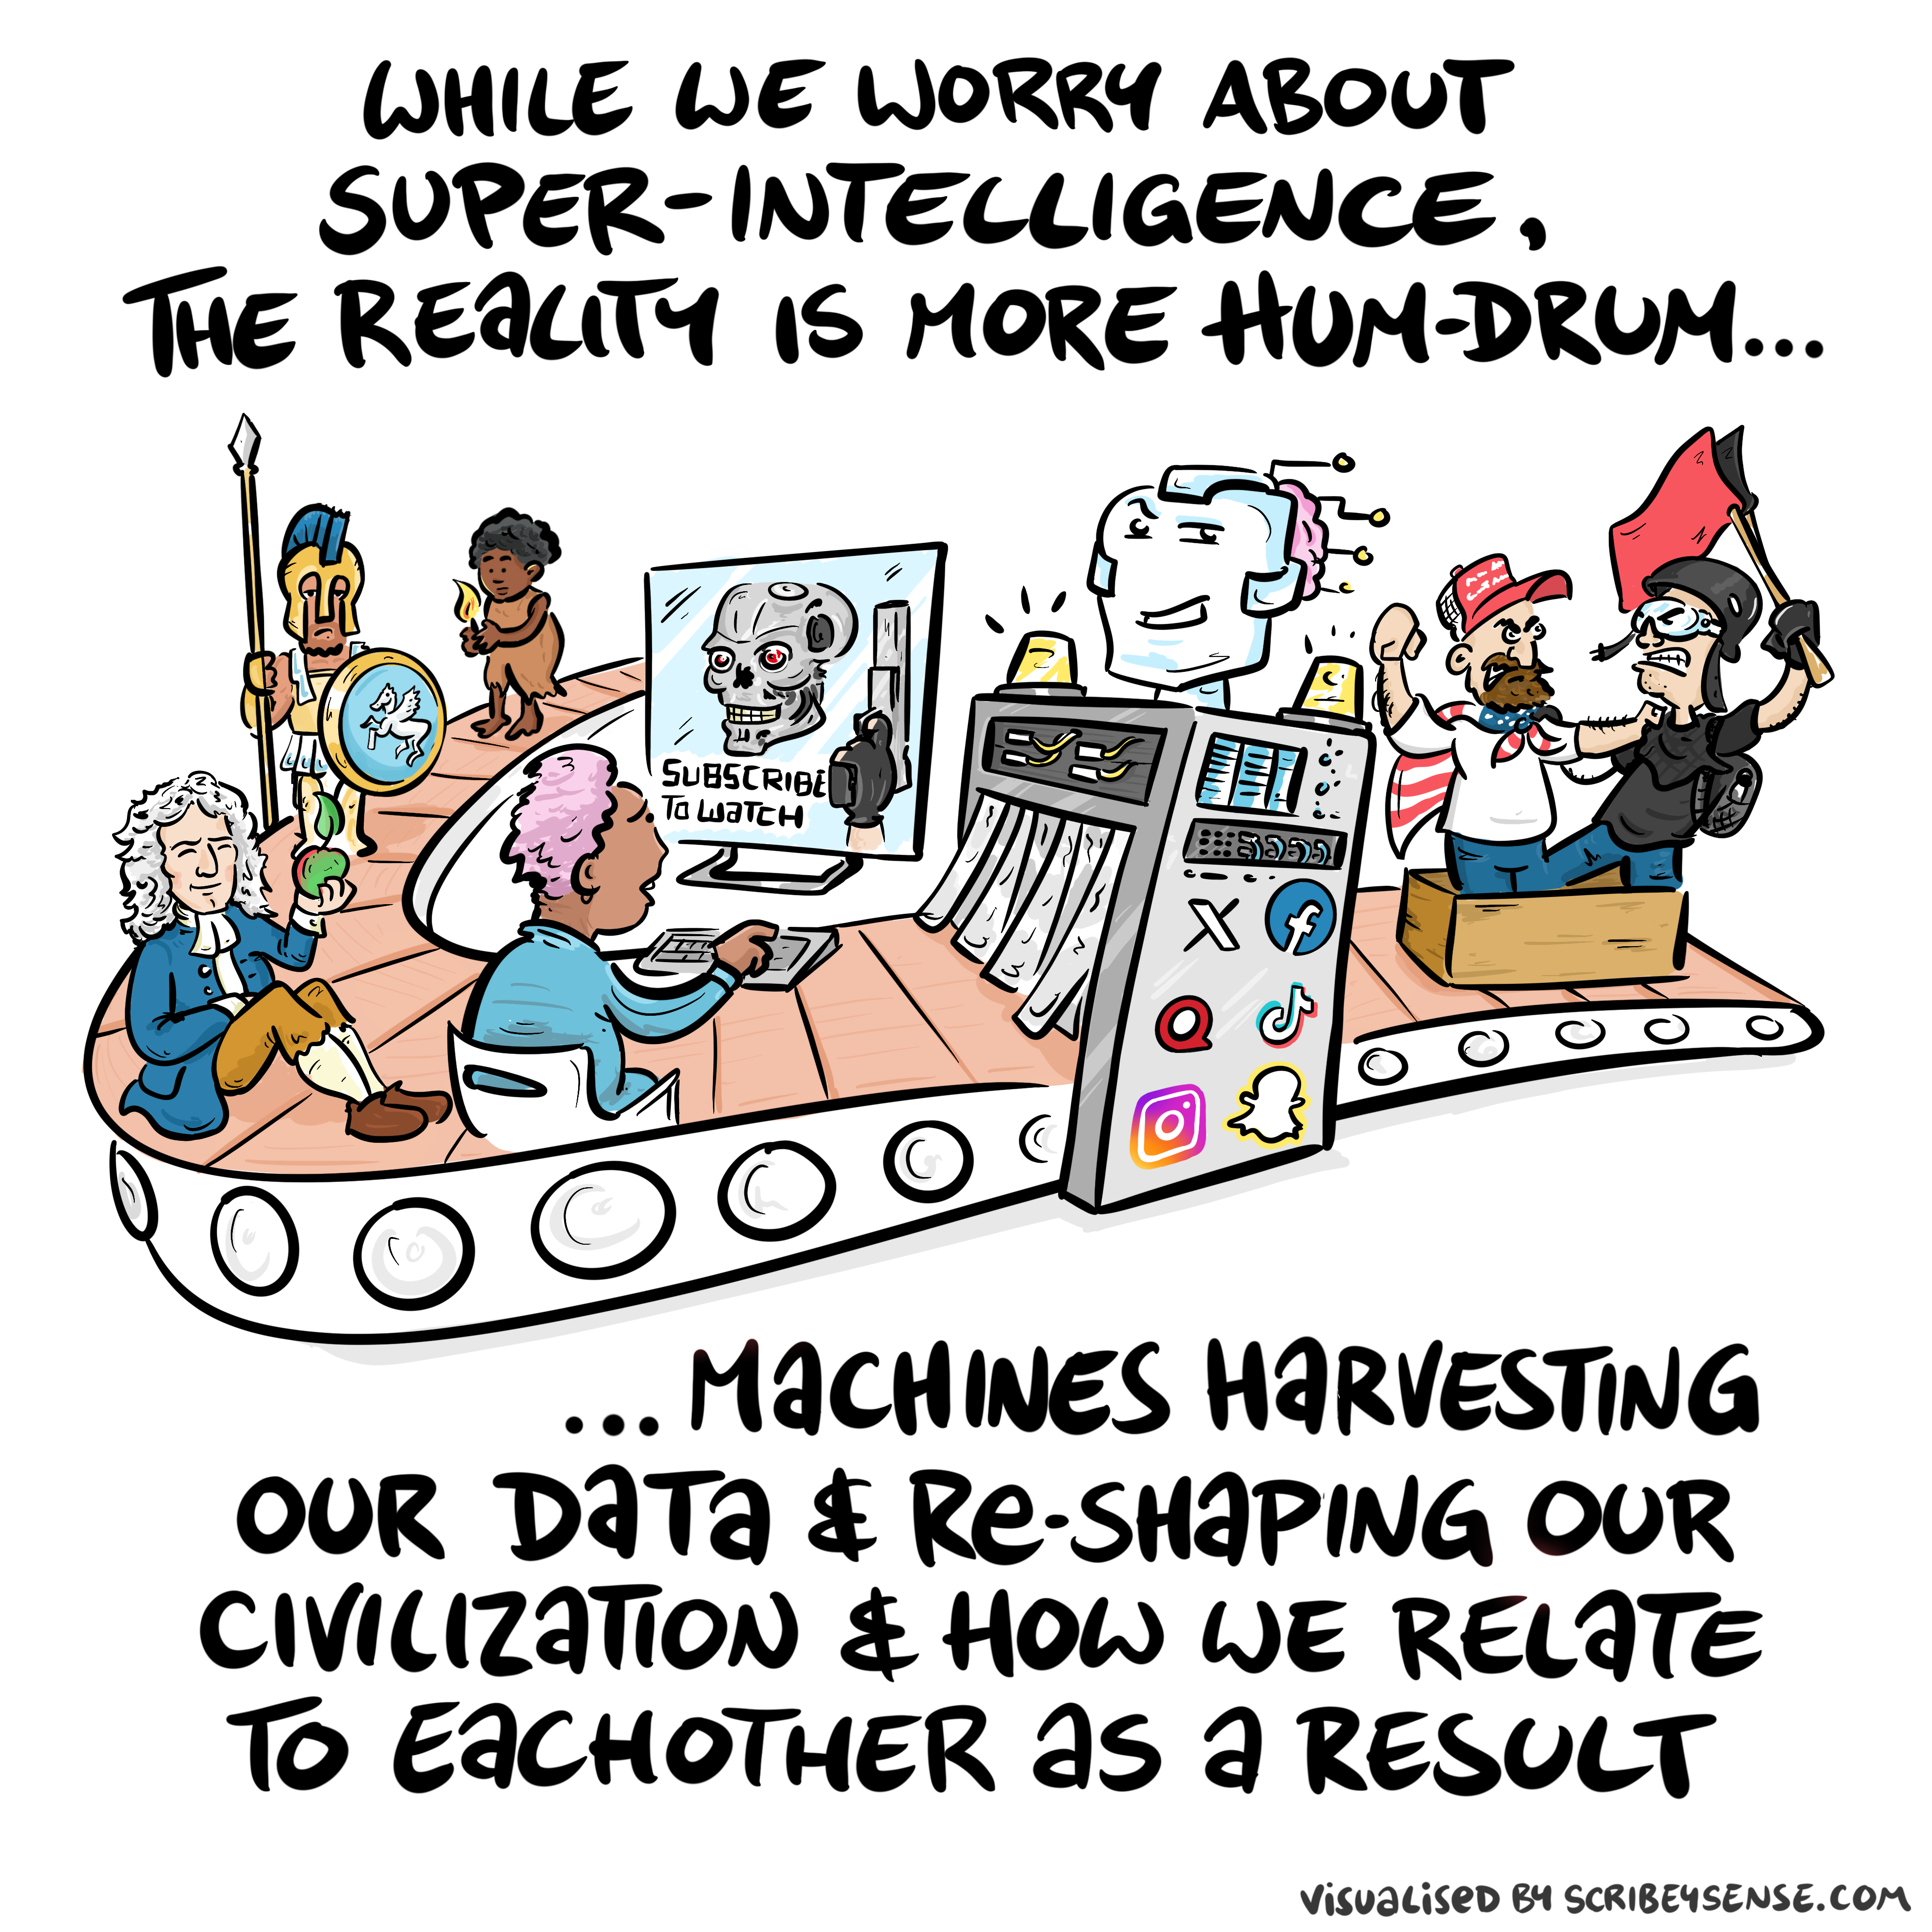
System Zero and executive controls
.
Controls that survive incentives
- Treat metrics as attack surfaces: what can be gamed, and how will you know?
- Build an escalation path: “pause when unsure”, human override, and incident response.
- Demand recourse: who can challenge/appeal a decision, and what evidence is recorded?
- Keep accountability human: delegation is optional; responsibility is not.
What to do on Monday (practical)
- Pick one high-stakes decision and write down:
- objective (what are we optimising?),
- data (what is missing?),
- failure modes (how can it be gamed?),
- monitoring (what triggers escalation?),
- owner (who is accountable?).
- Use DRLs as a readiness instrument, not a maturity badge.
Thanks!
company: Trent AI
book: The Atomic Human
twitter: @lawrennd
The Atomic Human pages trust 43, 79, 100 , embodiment factor 13, 29, 35, 79, 87, 105, 197, 216-217, 249, 269, 327, 353, 363, 369, topography, information 34-9, 43-8, 57, 62, 104, 115-16, 127, 140, 192, 196, 199, 291, 334, 354-5, objectives 29, 36, 83-4, 148, 149, 179, topography, information 34-9, 43-8, 57, 62, 104, 115-16, 127, 140, 192, 196, 199, 291, 334, 354-5, System Zero 242-7, 306, 309, 329, 350, 355, 359, 361, 363, 364, Gas Light (play)/gaslighting 302-3, social media 15, 80, 81, 86, 108, 226, 243, 244, 245, 247, 359, 360, 362, 364.
newspaper: Guardian Profile Page
blog posts:
Dan Andrews image from Chapter 3