Week : Data Quality and Data Readiness Levels
Abstract:
In this talk we consider data readiness levels and how they may be deployed.
The Gartner Hype Cycle

Figure: The Gartner Hype Cycle places technologies on a graph that relates to the expectations we have of a technology against its actual influence. Early hope for a new techology is often displaced by disillusionment due to the time it takes for a technology to be usefully deployed.
The Gartner Hype Cycle tries to assess where an idea is in terms of maturity and adoption. It splits the evolution of technology into a technological trigger, a peak of expectations followed by a trough of disillusionment and a final ascension into a useful technology. It looks rather like a classical control response to a final set point.
Cycle for ML Terms
Google Trends
%pip install pytrends
Figure: A Google trends search for ‘artificial intelligence’, ‘big data’, ‘data mining’, ‘deep learning’, ‘machine learning’ as different technological terms give us insight into their popularity over time.
Google trends gives us insight into the interest for different terms over time.
Examining Google trends search for ‘artificial intelligence’, ‘big data’, ‘data mining’, ‘deep learning’ and ‘machine learning’ we can see that ‘artificial intelligence’ may be entering a plateau of productivity, ‘big data’ is entering the trough of disillusionment, and ‘data mining’ seems to be deeply within the trough. On the other hand, ‘deep learning’ and ‘machine learning’ appear to be ascending to the peak of inflated expectations having experienced a technology trigger.
For deep learning that technology trigger was the ImageNet result of 2012 (Krizhevsky et al., n.d.). This step change in performance on object detection in images was achieved through convolutional neural networks, popularly known as ‘deep learning’.
Machine Learning
\[ \text{data} + \text{model} \stackrel{\text{compute}}{\rightarrow} \text{prediction} \]
Code and Data Separation
- Classical computer science separates code and data.
- Machine learning short-circuits this separation.
Example: Supply Chain
Electricity
There are parallels between the deployment of machine learning solutions and update as electricity as a means of powering industry. Tim Harford explores the reasons why it took time to exploit the power of electricity in the manufacturing industry. The true benefit of electricity came when machinery had electric motors incorporated. Substituting a centralized steam engine in a manufacturing plant with a centralized electric motor didn’t reduce costs or improve the reconfigurability of a factory. The real advantages came when the belt drives that were necessary to redistribute power were replaced with electric cables and energy was transformed into motion at the machine rather than centrally. This gives a manufacturing plant reconfigurability.
We can expect to see the same thing with our machine learning capabilities. In the analogy our existing software systems are the steam power, and data driven systems are equivalent to electricity. Currently software engineers create information processing entities (programs) in a centralized manner, where as data driven systems are reactive and responsive to their environment. Just as with electricity this brings new flexibility to our systems, but new dangers as well.
The Physical World: Where Bits meet Atoms
The change from atoms to bits is irrevocable and unstoppable. Why now? Because the change is also exponential — small differences of yesterday can have suddenly shocking consequences tomorrow.
Nicholas Negroponte, Being Digital 1995
Before I joined Amazon I was invited to speak at their annual Machine Learning Conference. It has over two thousand attendees. I met the Vice President in charge of Amazon Special Projects, Babak Parviz. He said to me, the important thing about Amazon is that it’s a “bits and atoms” company, meaning it moves both stuff (atoms) and information (bits). This quote resonated with me because it maps well on to my own definition of intelligence. Moving stuff requires resource. Moving, or processing, of information to move stuff more efficiently requires intelligence.
That notion is the most fundamental notion for how the modern information infrastructure can help society. At Amazon the place where bits meet atoms is the supply chain. The movement of goods from manufacturer to customer, the supply chain.
There is a gap between the world of data science and AI. The mapping of the virtual onto the physical world, e.g causal and mechanistic understanding.
Supply Chain


Figure: Packhorse Bridge under Burbage Edge. This packhorse route climbs steeply out of Hathersage and heads towards Sheffield. Packhorses were the main route for transporting goods across the Peak District. The high cost of transport is one driver of the ‘smith’ model, where there is a local skilled person responsible for assembling or creating goods (e.g. a blacksmith).
On Sunday mornings in Sheffield, I often used to run across Packhorse Bridge in Burbage valley. The bridge is part of an ancient network of trails crossing the Pennines that, before Turnpike roads arrived in the 18th century, was the main way in which goods were moved. Given that the moors around Sheffield were home to sand quarries, tin mines, lead mines and the villages in the Derwent valley were known for nail and pin manufacture, this wasn’t simply movement of agricultural goods, but it was the infrastructure for industrial transport.
The profession of leading the horses was known as a Jagger and leading out of the village of Hathersage is Jagger’s Lane, a trail that headed underneath Stanage Edge and into Sheffield.
The movement of goods from regions of supply to areas of demand is fundamental to our society. The physical infrastructure of supply chain has evolved a great deal over the last 300 years.
Cromford
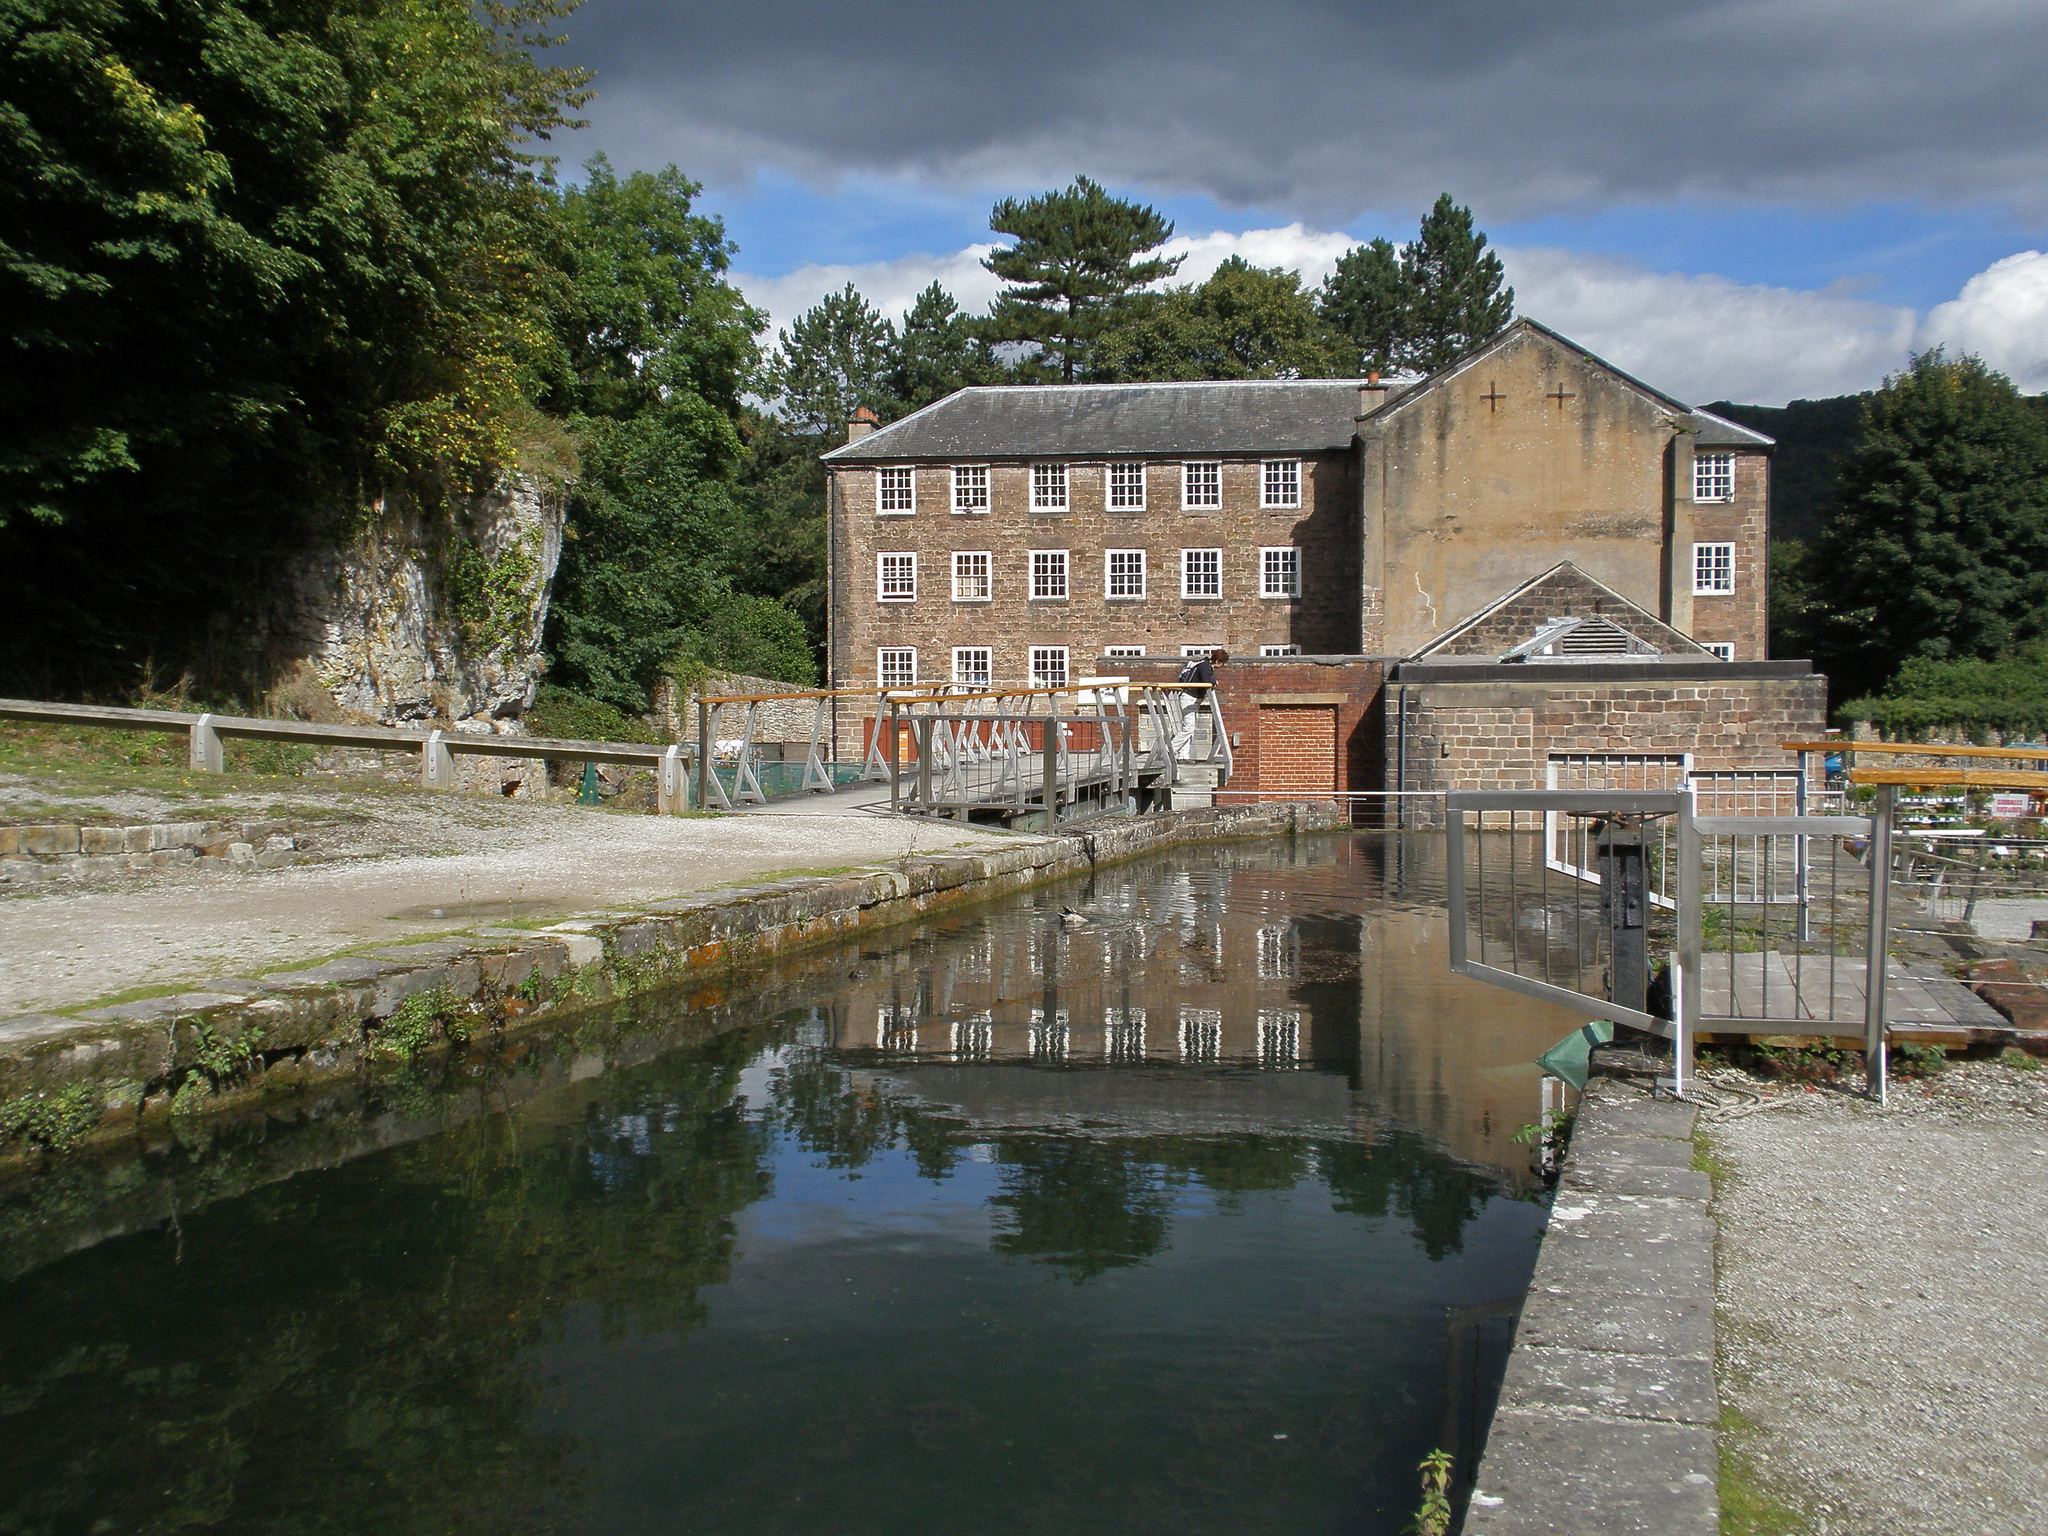

Figure: Richard Arkwright is regarded of the founder of the modern factory system. Factories exploit distribution networks to centralize production of goods. Arkwright located his factory in Cromford due to proximity to Nottingham Weavers (his market) and availability of water power from the tributaries of the Derwent river. When he first arrived there was almost no transportation network. Over the following 200 years The Cromford Canal (1790s), a Turnpike (now the A6, 1816-18) and the High Peak Railway (now closed, 1820s) were all constructed to improve transportation access as the factory blossomed.
Richard Arkwright is known as the father of the modern factory system. In 1771 he set up a Mill for spinning cotton yarn in the village of Cromford, in the Derwent Valley. The Derwent valley is relatively inaccessible. Raw cotton arrived in Liverpool from the US and India. It needed to be transported on packhorse across the bridleways of the Pennines. But Cromford was a good location due to proximity to Nottingham, where weavers where consuming the finished thread, and the availability of water power from small tributaries of the Derwent river for Arkwright’s water frames which automated the production of yarn from raw cotton.
By 1794 the Cromford Canal was opened to bring coal in to Cromford and give better transport to Nottingham. The construction of the canals was driven by the need to improve the transport infrastructure, facilitating the movement of goods across the UK. Canals, roads and railways were initially constructed by the economic need for moving goods. To improve supply chain.
The A6 now does pass through Cromford, but at the time he moved there there was merely a track. The High Peak Railway was opened in 1832, it is now converted to the High Peak Trail, but it remains the highest railway built in Britain.
Cooper (1991)
Containerization
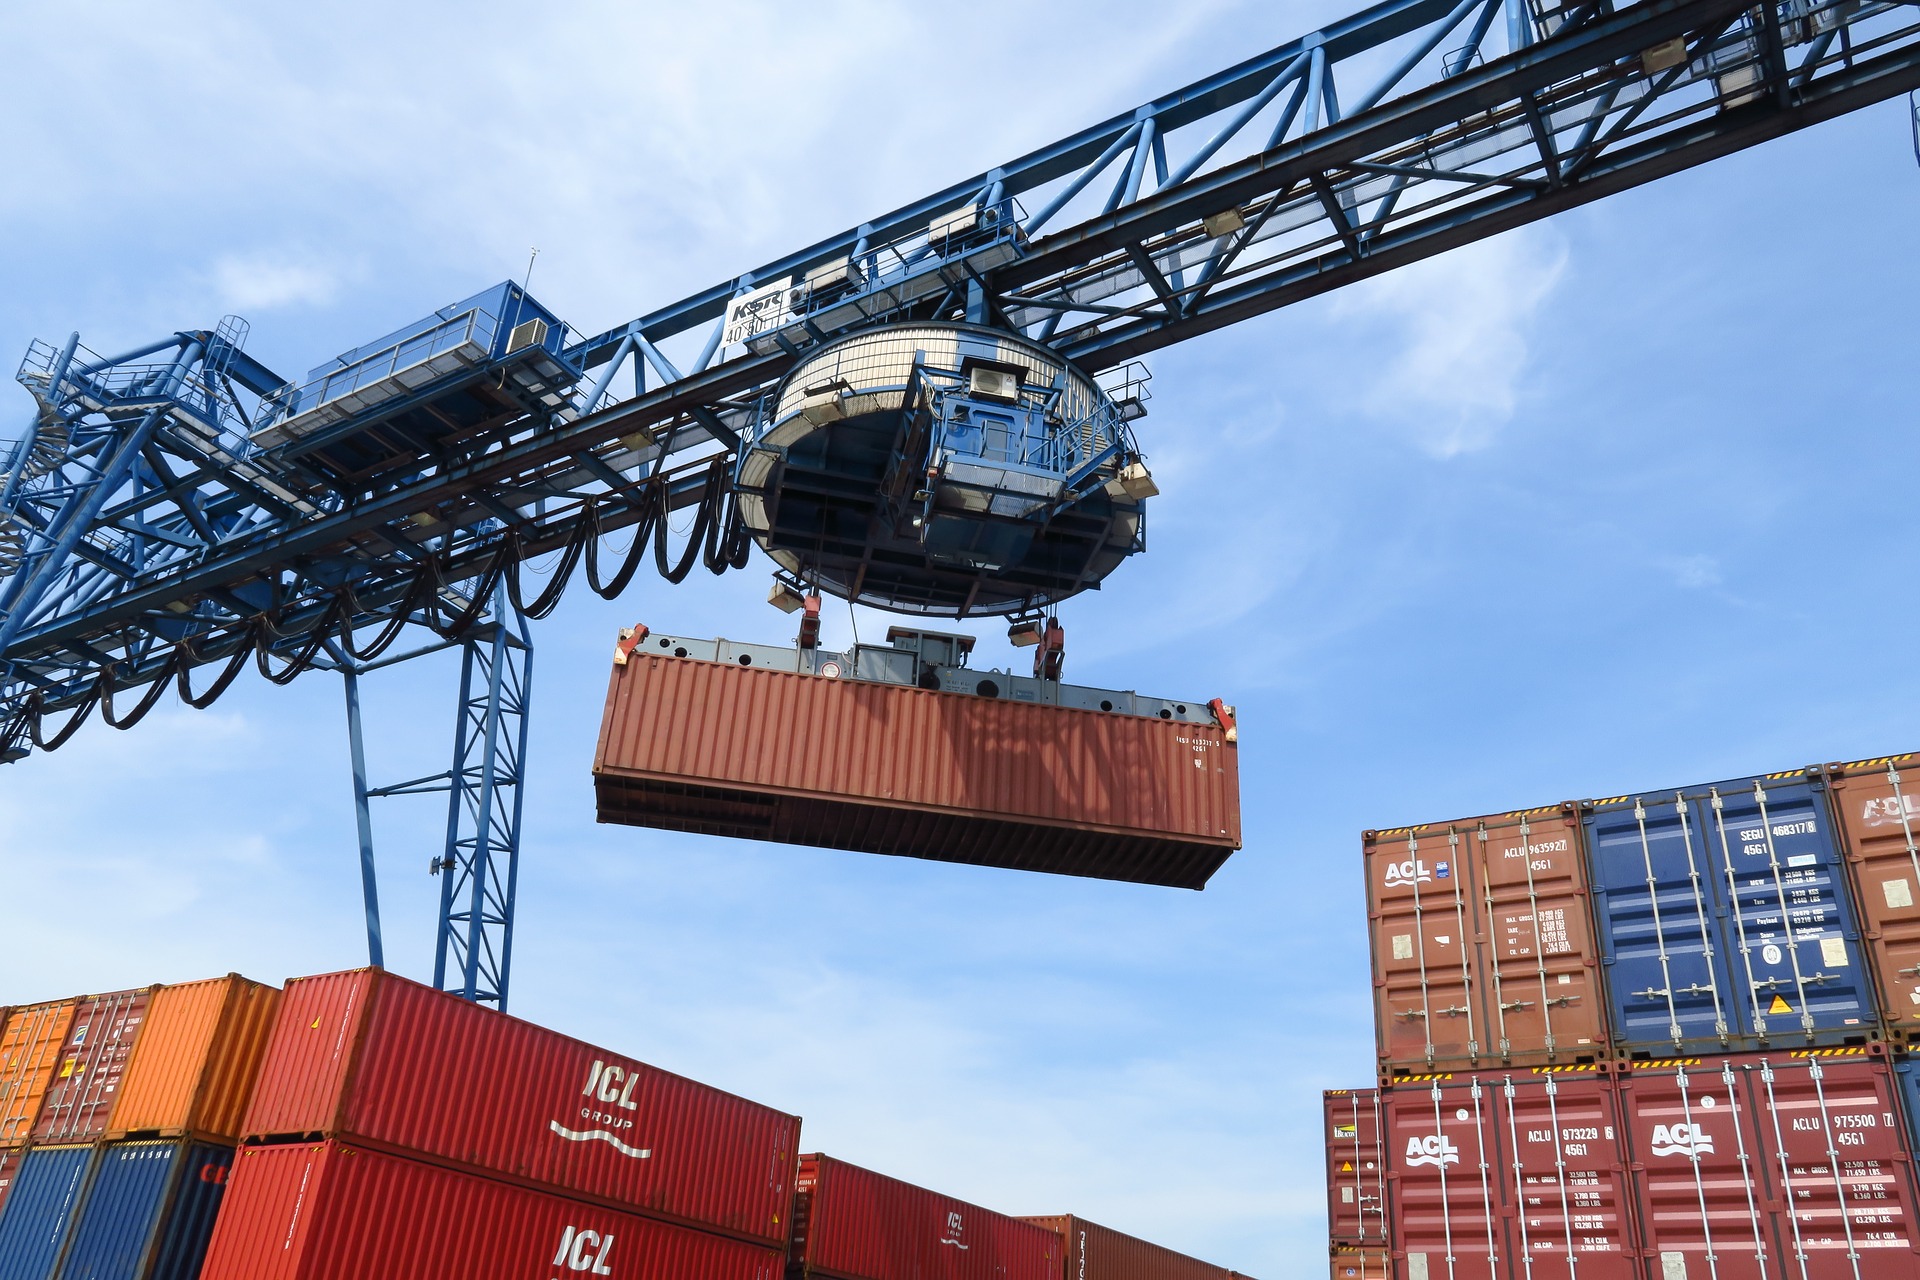

Figure: The container is one of the major drivers of globalization, and arguably the largest agent of social change in the last 100 years. It reduces the cost of transportation, significantly changing the appropriate topology of distribution networks. The container makes it possible to ship goods halfway around the world for cheaper than it costs to process those goods, leading to an extended distribution topology.
Containerization has had a dramatic effect on global economics, placing many people in the developing world at the end of the supply chain.

|
|

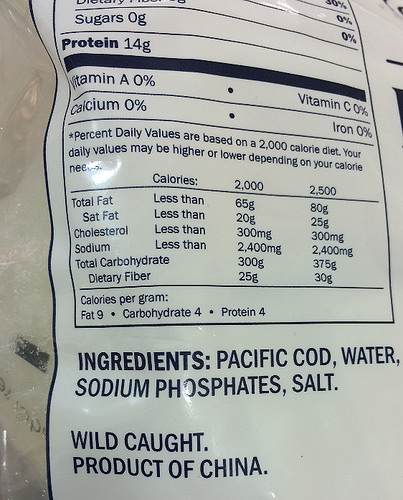
Figure: Wild Alaskan Cod, being solid in the Pacific Northwest, that is a product of China. It is cheaper to ship the deep frozen fish thousands of kilometers for processing than to process locally.
For example, you can buy Wild Alaskan Cod fished from Alaska, processed in China, sold in North America. This is driven by the low cost of transport for frozen cod vs the higher relative cost of cod processing in the US versus China. Similarly, Scottish prawns are also processed in China for sale in the UK.


Figure: The transport cost of most foods is a very small portion of the total cost. The exception is if foods are air freighted. Source: https://ourworldindata.org/food-choice-vs-eating-local by Hannah Ritche CC-BY
This effect on cost of transport vs cost of processing is the main driver of the topology of the modern supply chain and the associated effect of globalization. If transport is much cheaper than processing, then processing will tend to agglomerate in places where processing costs can be minimized.
Large scale global economic change has principally been driven by changes in the technology that drives supply chain.
Supply chain is a large-scale automated decision making network. Our aim is to make decisions not only based on our models of customer behavior (as observed through data), but also by accounting for the structure of our fulfilment center, and delivery network.
Many of the most important questions in supply chain take the form of counterfactuals. E.g. “What would happen if we opened a manufacturing facility in Cambridge?” A counter factual is a question that implies a mechanistic understanding of a system. It goes beyond simple smoothness assumptions or translation invariants. It requires a physical, or mechanistic understanding of the supply chain network. For this reason, the type of models we deploy in supply chain often involve simulations or more mechanistic understanding of the network.
In supply chain Machine Learning alone is not enough, we need to bridge between models that contain real mechanisms and models that are entirely data driven.
This is challenging, because as we introduce more mechanism to the models we use, it becomes harder to develop efficient algorithms to match those models to data.
Data Science Africa


Figure: Data Science Africa http://datascienceafrica.org is a ground up initiative for capacity building around data science, machine learning and artificial intelligence on the African continent.

Figure: Data Science Africa meetings held up to October 2021.
Data Science Africa is a bottom up initiative for capacity building in data science, machine learning and artificial intelligence on the African continent.
As of May 2023 there have been eleven workshops and schools, located in seven different countries: Nyeri, Kenya (twice); Kampala, Uganda; Arusha, Tanzania; Abuja, Nigeria; Addis Ababa, Ethiopia; Accra, Ghana; Kampala, Uganda and Kimberley, South Africa (virtual), and in Kigali, Rwanda.
The main notion is end-to-end data science. For example, going from data collection in the farmer’s field to decision making in the Ministry of Agriculture. Or going from malaria disease counts in health centers to medicine distribution.
The philosophy is laid out in (Lawrence, 2015). The key idea is that the modern information infrastructure presents new solutions to old problems. Modes of development change because less capital investment is required to take advantage of this infrastructure. The philosophy is that local capacity building is the right way to leverage these challenges in addressing data science problems in the African context.
Data Science Africa is now a non-govermental organization registered in Kenya. The organising board of the meeting is entirely made up of scientists and academics based on the African continent.
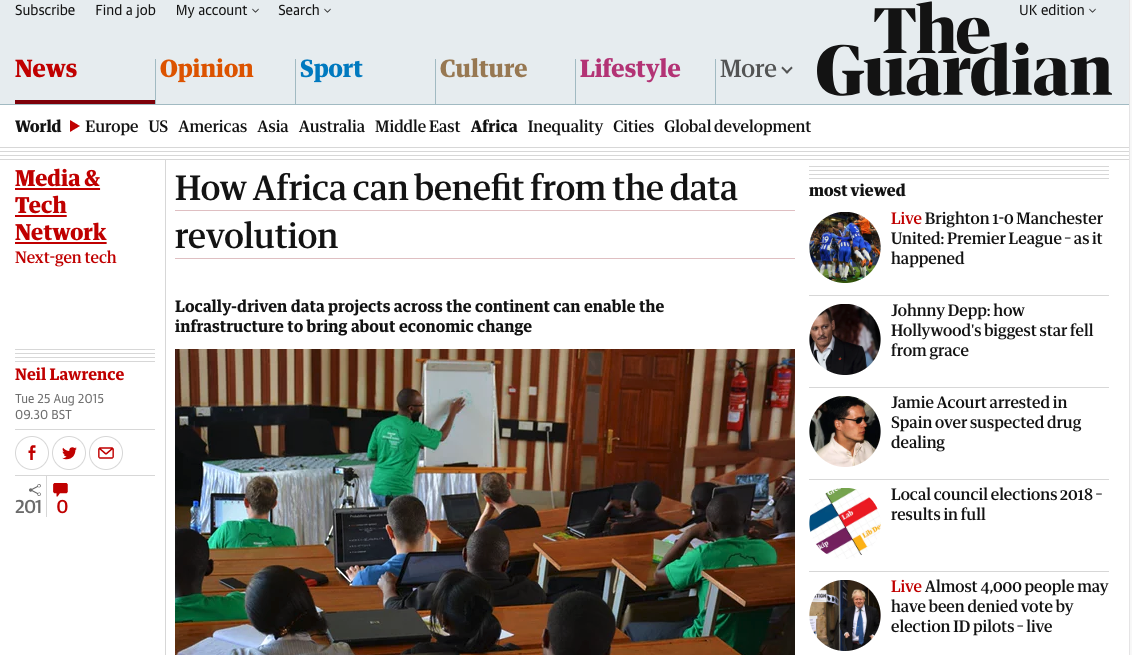

Figure: The lack of existing physical infrastructure on the African continent makes it a particularly interesting environment for deploying solutions based on the information infrastructure. The idea is explored more in this Guardian op-ed on Guardian article on How African can benefit from the data revolution.
Guardian article on Data Science Africa
Crop Monitoring


Figure: Mobile Monitoring of Crop Disease
Biosurveillance


Figure: Spatiotemporal Models for Biosurveillance
Community Radio


Figure: Ugandan Community Radio Project
Kudu Project
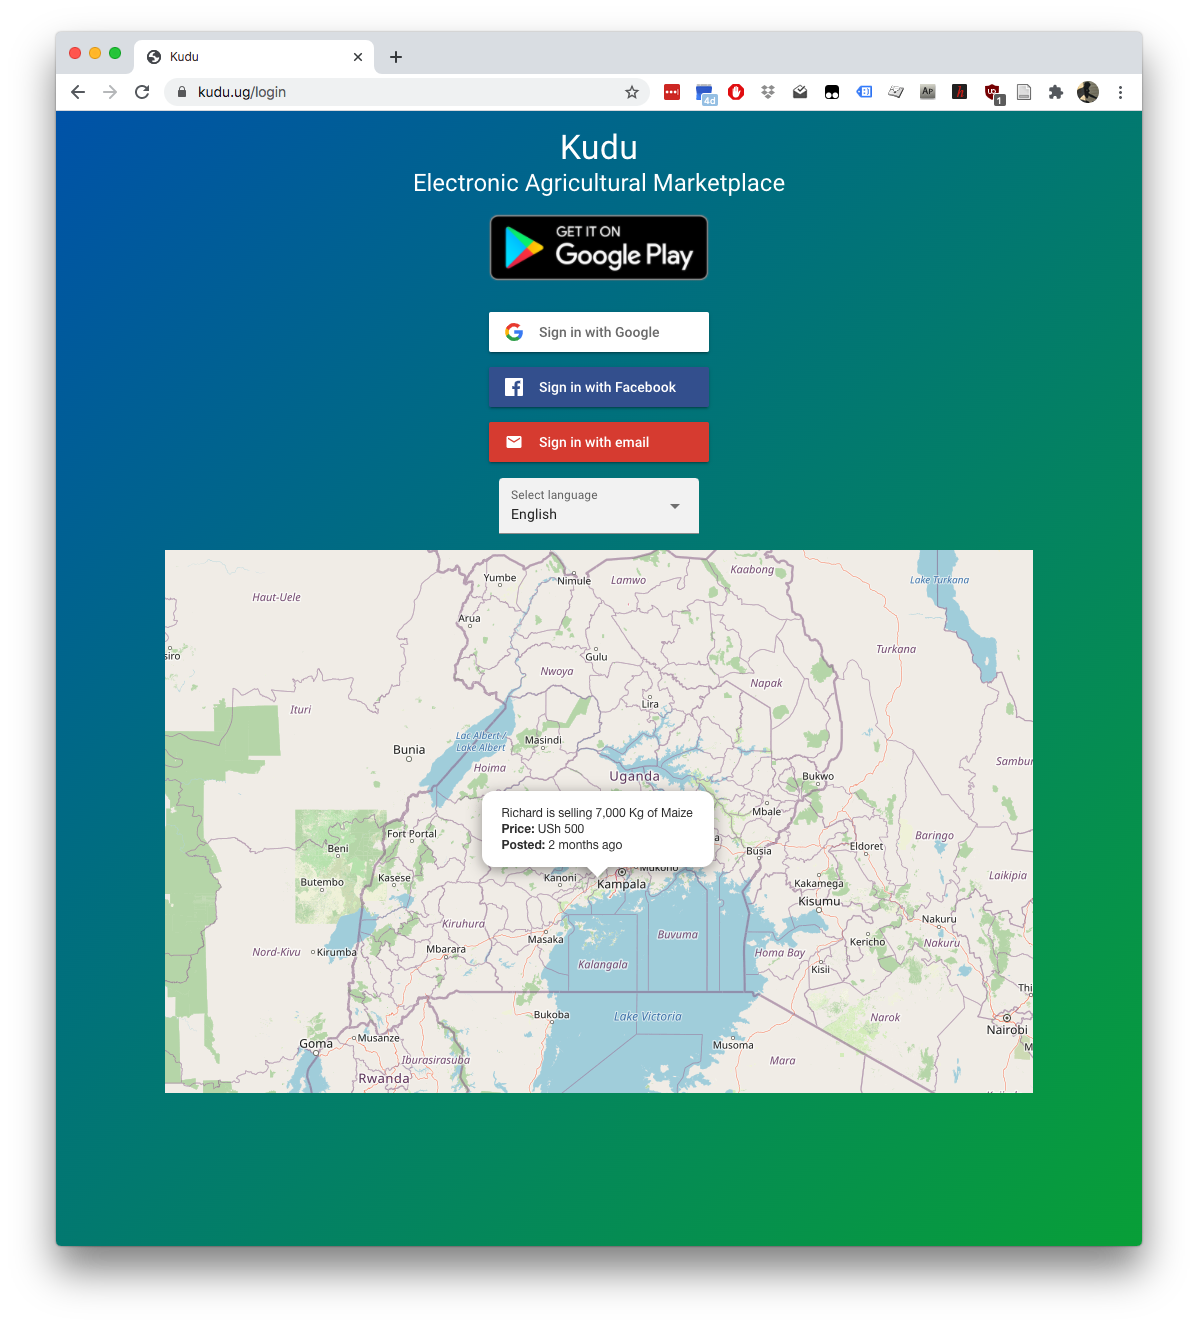

Figure: Kudu Project
Safe Boda


Figure: Safe Boda
One thing about working in an industrial environment, is the way that short-term thinking actions become important. For example, in Formula One, the teams are working on a two-week cycle to digest information from the previous week’s race and incorporate updates to the car or their strategy.
However, businesses must also think about more medium-term horizons. For example, in Formula 1 you need to worry about next year’s car. So, while you’re working on updating this year’s car, you also need to think about what will happen for next year and prioritize these conflicting needs appropriately.
In the Amazon supply chain, there are equivalent demands. If we accept that an artificial intelligence is just an automated decision-making system. And if we measure in terms of money automatically spent, or goods automatically moved, then Amazon’s buying system is perhaps the world’s largest AI.
Those decisions are being made on short time schedules; purchases are made by the system on weekly cycles. But just as in Formula 1, there is also a need to think about what needs to be done next month, next quarter and next year. Planning meetings are held not only on a weekly basis (known as weekly business reviews), but monthly, quarterly, and then yearly meetings for planning spends and investments.
Amazon is known for being longer term thinking than many companies, and a lot of this is coming from the CEO. One quote from Jeff Bezos that stuck with me was the following.
“I very frequently get the question: ‘What’s going to change in the next 10 years?’ And that is a very interesting question; it’s a very common one. I almost never get the question: ‘What’s not going to change in the next 10 years?’ And I submit to you that that second question is actually the more important of the two – because you can build a business strategy around the things that are stable in time. … [I]n our retail business, we know that customers want low prices, and I know that’s going to be true 10 years from now. They want fast delivery; they want vast selection. It’s impossible to imagine a future 10 years from now where a customer comes up and says, ‘Jeff I love Amazon; I just wish the prices were a little higher,’ [or] ‘I love Amazon; I just wish you’d deliver a little more slowly.’ Impossible. And so the effort we put into those things, spinning those things up, we know the energy we put into it today will still be paying off dividends for our customers 10 years from now. When you have something that you know is true, even over the long term, you can afford to put a lot of energy into it.”
This quote is incredibly important for long term thinking. Indeed, it’s a failure of many of our simulations that they focus on what is going to happen, not what will not happen. In Amazon, this meant that there was constant focus on these three areas, keeping costs low, making delivery fast and improving selection. For example, shortly before I left Amazon moved its entire US network from two-day delivery to one-day delivery. This involves changing the way the entire buying system operates. Or, more recently, the company has had to radically change the portfolio of products it buys in the face of Covid19.

Figure: Experiment, analyze and design is a flywheel of knowledge that is the dual of the model, data and compute. By running through this spiral, we refine our hypothesis/model and develop new experiments which can be analyzed to further refine our hypothesis.
From the perspective of the team that we had in the supply chain, we looked at what we most needed to focus on. Amazon moves very quickly, but we could also take a leaf out of Jeff’s book, and instead of worrying about what was going to change, remember what wasn’t going to change.
We don’t know what science we’ll want to do in five years’ time, but we won’t want slower experiments, we won’t want more expensive experiments and we won’t want a narrower selection of experiments.
As a result, our focus was on how to speed up the process of experiments, increase the diversity of experiments that we can do, and keep the experiments price as low as possible.
The faster the innovation flywheel can be iterated, then the quicker we can ask about different parts of the supply chain, and the better we can tailor systems to answering those questions.
We need faster, cheaper and more diverse experiments which implies we need better ecosystems for experimentation. This has led us to focus on the software frameworks we’re using to develop machine learning systems including data oriented architectures (Borchert (2020);Lawrence (2019);Vorhemus and Schikuta (2017);Joshi (2007)), data maturity assessments (Lawrence et al. (2020)) and data readiness levels (See this blog post on Data Readiness Levels. and Lawrence (2017);The DELVE Initiative (2020))
As a result, our objective became a two-order magnitude increase in number of experiments run across a five-year period.
Operations Research, Control, Econometrics, Statistics and Machine Learning
\(\text{data} + \text{model}\) is not new, it dates back to Laplace and Gauss. Gauss fitted the orbit of Ceres using Keplers laws of planetary motion to generate his basis functions, and Laplace’s insights on the error function and uncertainty (Stigler, 1999). Different fields such as Operations Research, Control, Econometrics, Statistics, Machine Learning and now Data Science and AI all rely on \(\text{data} + \text{model}\). Under a Popperian view of science, and equating experiment to data, one could argue that all science has \(\text{data} + \text{model}\) underpinning it.
Different academic fields are born in different eras, driven by different motivations and arrive at different solutions. For example, both Operations Research and Control emerged from the Second World War. Operations Research, the science of decision making, driven by the need for improved logistics and supply chain. Control emerged from cybernetics, a field that was driven in the by researchers who had been involved in radar and decryption (Husband et al., 2008; Wiener, 1948). The UK artificial intelligence community had similar origins (Copeland, 2006).
The separation between these fields has almost become tribal, and from one perspective this can be very helpful. Each tribe can agree on a common language, a common set of goals and a shared understanding of the approach they’ve chose for those goals. This ensures that best practice can be developed and shared and as a result, quality standards can rise.
This is the nature of our professions. Medics, lawyers, engineers and accountants all have a system of shared best practice that they deploy efficiently in the resolution of a roughly standardized set of problems where they deploy (broken leg, defending a libel trial, bridging a river, ensuring finances are correct).
Control, statistics, economics, operations research are all established professions. Techniques are established, often at undergraduate level, and graduation to the profession is regulated by professional bodies. This system works well as long as the problems we are easily categorized and mapped onto the existing set of known problems.
However, at another level our separate professions of OR, statistics and control engineering are just different views on the same problem. Just as any tribe of humans need to eat and sleep, so do these professions depend on data, modelling, optimization and decision-making.
We are doing something that has never been done before, optimizing and evolving very large-scale automated decision making networks. The ambition to scale and automate, in a data driven manner, means that a tribal approach to problem solving can hinder our progress. Any tribe of hunter gatherers would struggle to understand the operation of a modern city. Similarly, supply chain needs to develop cross-functional skill sets to address the modern problems we face, not the problems that were formulated in the past.
Many of the challenges we face are at the interface between our tribal expertise. We have particular cost functions we are trying to minimize (an expertise of OR) but we have large scale feedbacks in our system (an expertise of control). We also want our systems to be adaptive to changing circumstances, to perform the best action given the data available (an expertise of machine learning and statistics).
Taking the tribal analogy further, we could imagine each of our professions as a separate tribe of hunter-gathers, each with particular expertise (e.g. fishing, deer hunting, trapping). Each of these tribes has their own approach to eating to survive, just as each of our localized professions has its own approach to modelling. But in this analogy, the technological landscapes we face are not wildernesses, they are emerging metropolises. Our new task is to feed our population through a budding network of supermarkets. While we may be sourcing our food in the same way, this requires new types of thinking that don’t belong in the pure domain of any of our existing tribes.
For our biggest challenges, focusing on the differences between these fields is unhelpful, we should consider their strengths and how they overlap. Fundamentally all these fields are focused on taking the right action given the information available to us. They need to work in synergy for us to make progress.
While there is some discomfort in talking across field boundaries, it is critical to disconfirming our current beliefs and generating the new techniques we need to address the challenges before us.
Recommendation: We should be aware of the limitations of a single tribal view of any of our problem sets. Where our modelling is dominated by one perspective (e.g. economics, OR, control, ML) we should ensure cross fertilization of ideas occurs through scientific review and team rotation mechanisms that embed our scientists (for a short period) in different teams across our organizations.
Data Readiness Levels
Data Readiness Levels
Data Readiness Levels (Lawrence, 2017) are an attempt to develop a language around data quality that can bridge the gap between technical solutions and decision makers such as managers and project planners. They are inspired by Technology Readiness Levels which attempt to quantify the readiness of technologies for deployment.
See this blog post on Data Readiness Levels.
Three Grades of Data Readiness
Data-readiness describes, at its coarsest level, three separate stages of data graduation.
- Grade C - accessibility
- Transition: data becomes electronically available
- Grade B - validity
- Transition: pose a question to the data.
- Grade A - usability
The important definitions are at the transition. The move from Grade C data to Grade B data is delimited by the electronic availability of the data. The move from Grade B to Grade A data is delimited by posing a question or task to the data (Lawrence, 2017).
Accessibility: Grade C
The first grade refers to the accessibility of data. Most data science practitioners will be used to working with data-providers who, perhaps having had little experience of data-science before, state that they “have the data”. More often than not, they have not verified this. A convenient term for this is “Hearsay Data”, someone has heard that they have the data so they say they have it. This is the lowest grade of data readiness.
Progressing through Grade C involves ensuring that this data is accessible. Not just in terms of digital accessiblity, but also for regulatory, ethical and intellectual property reasons.
Validity: Grade B
Data transits from Grade C to Grade B once we can begin digital analysis on the computer. Once the challenges of access to the data have been resolved, we can make the data available either via API, or for direct loading into analysis software (such as Python, R, Matlab, Mathematica or SPSS). Once this has occured the data is at B4 level. Grade B involves the validity of the data. Does the data really represent what it purports to? There are challenges such as missing values, outliers, record duplication. Each of these needs to be investigated.
Grade B and C are important as if the work done in these grades is documented well, it can be reused in other projects. Reuse of this labour is key to reducing the costs of data-driven automated decision making. There is a strong overlap between the work required in this grade and the statistical field of exploratory data analysis (Tukey, 1977).
The need for Grade B emerges due to the fundamental change in the availability of data. Classically, the scientific question came first, and the data came later. This is still the approach in a randomized control trial, e.g. in A/B testing or clinical trials for drugs. Today data is being laid down by happenstance, and the question we wish to ask about the data often comes after the data has been created. The Grade B of data readiness ensures thought can be put into data quality before the question is defined. It is this work that is reusable across multiple teams. It is these processes that the team which is standing up the data must deliver.
Usability: Grade A
Once the validity of the data is determined, the data set can be considered for use in a particular task. This stage of data readiness is more akin to what machine learning scientists are used to doing in universities. Bringing an algorithm to bear on a well understood data set.
In Grade A we are concerned about the utility of the data given a particular task. Grade A may involve additional data collection (experimental design in statistics) to ensure that the task is fulfilled.
This is the stage where the data and the model are brought together, so expertise in learning algorithms and their application is key. Further ethical considerations, such as the fairness of the resulting predictions are required at this stage. At the end of this stage a prototype model is ready for deployment.
Deployment and maintenance of machine learning models in production is another important issue which Data Readiness Levels are only a part of the solution for.
Recursive Effects
To find out more, or to contribute ideas go to http://data-readiness.org
Throughout the data preparation pipeline, it is important to have close interaction between data scientists and application domain experts. Decisions on data preparation taken outside the context of application have dangerous downstream consequences. This provides an additional burden on the data scientist as they are required for each project, but it should also be seen as a learning and familiarization exercise for the domain expert. Long term, just as biologists have found it necessary to assimilate the skills of the bioinformatician to be effective in their science, most domains will also require a familiarity with the nature of data driven decision making and its application. Working closely with data-scientists on data preparation is one way to begin this sharing of best practice.
The processes involved in Grade C and B are often badly taught in courses on data science. Perhaps not due to a lack of interest in the areas, but maybe more due to a lack of access to real world examples where data quality is poor.
These stages of data science are also ridden with ambiguity. In the long term they could do with more formalization, and automation, but best practice needs to be understood by a wider community before that can happen.
Data Maturity Assessment
As part of the work for DELVE on Data Readiness in an Emergency (The DELVE Initiative, 2020), we made recommendations around assessing data maturity, (Lawrence et al., 2020). These recommendations were part of a range of suggestions for government to adopt to improve data driven decision making.
Characterising Data Maturity
Diferent organisations differ in their ability to handle data. A data maturity assessment reviews the ways in which best practice in data management and use is embedded in teams, departments, and business processes. These indicators are themed according to the maturity level. These characteristics would be reviewed in aggregate to give a holistic picture of data management across an organisation.
1. Reactive
Data sharing is not possible or ad-hoc at best.
It is difficult to identify relevant data sets and their owners.
It is possible to access data, but this may take significant time, energy and personal connections.
Data is most commonly shared via ad hoc means, like attaching it to an email.
The quality of data available means that it is often incorrect or incomplete.
2. Repeatable
Some limited data service provision is possible and expected, in particular between neighboring teams. Some limited data provision to distinct teams may also be possible.
Data analysis and documentation is of sufficient quality to enable its replication one year later.
There are standards for documentation that ensure that data is usable across teams.
The time and effort involved in data preparation are commonly understood.
Data is used to inform decision-making, though not always routinely.
3. Managed and Integrated
Data is available through published APIs; corrections to requested data are monitored and API service quality is discussed within the team. Data security protocols are partially automated ensuring electronic access for the data is possible.
Within the organisation, teams publish and share data as a supported output.
Documentation is of sufficient quality to enable teams across the organisation that were not involved in its collection to use it directly.
Procedures for data access are documented for other teams, and there is a way to obtain secure access to data.
4. Optimized
Teams provide reliable data services to other teams. The security and privacy implications of data sharing are automatically handled through privacy and security aware ecosystems.
Within teams, data quality is constantly monitored, for instance through a dashboard. Errors could be flagged for correction.
There are well-established processes to allow easy sharing of high-quality data across teams and track how the same datasets are used by multiple teams across the organisation.
Data API access is streamlined by an approval process for joining digital security groups.
5. Transparent
Internal organizational data is available to external organizations with appropriate privacy and security policies. Decision making across the organisation is data-enabled, with transparent metrics that could be audited through organisational data logs. If appropriate governance frameworks are agreed, data dependent services (including AI systems) could be rapidly and securely redeployed on company data in the service of national emergencies.
Data from APIs are combined in a transparent way to enable decision-making, which could be fully automated or through the organizationâs management.
Data generated by teams within the organisation can be used by people outside of the organization.
Example Data Maturity Questions
Below is a set of questions that could be used in an organisation for assessing data maturity. The questions are targeted at individuals in roles where the decisions are data driven.
- I regularly use data to make decisions in my job.
- I don’t always know what data is available, or what data is best for my needs.
- It is easy to obtain access to the data I need.
- I document the processes I apply to render data usable for my department.
- To access the data I need from my department I need to email or talk to my colleagues.
- The data I would like to use is too difficult to obtain due to security restrictions.
- When dealing with a new data set, I can assess whether it is fit for my purposes in less than two hours.
- My co-workers appreciate the time and difficulty involved in preparing data for a task
- My management appreciates the time and difficulty involved in preparing data for a task.
- I can repeat data analysis I created greater than 6 months ago.
- I can repeat data analysis my team created from greater than 6 months ago.
- To repeat a data analysis from another member of my team I need to speak to that person directly.
- The data my team owns is documented well enough to enable people outside the team to use it directly.
- My team monitors the quality of the data it owns through the use of issue tracking (e.g. trouble tickets).
- The data my team generates is used by other teams inside my department.
- The data my team generates is used by other teams outside my department.
- The data my team generates is used by other teams, though I’m not sure who.
- The data my team generates is used by people outside of the organization.
- I am unable to access the data I need due to technical challenges.
- The quality of the data I commonly access is always complete and correct.
- The quality of the data I commonly access is complete, but not always correct.
- The quality of the data I commonly access is often incorrect or incomplete.
- When seeking data, I find it hard to find the data owner and request access.
- When seeking data, I am normally able to directly access the data in its original location
- Poor documentation is a major problem for me when using data from outside my team.
- My team has a formal process for identifying and correcting errors in our data.
- In my team it is easy to obtain resource for making clean data available to other teams.
- For projects analyzing data my team owns, the majority of our time is spent on understanding data provenance.
- For projects analyzing data other teams own, the majority of our time is spent on understanding data provenance.
- My team views data wrangling as a specialized role and resources it accordingly.
- My team can account for each data set they manage.
- When a colleague requests data, the easiest way to share it is to attach it to an email.
- My team’s main approach to analysis is to view the data in a spreadsheet program.
- My team has goals that are centred around improving data quality.
- The easiest way for me to share data outside the team is to provide a link to a document that explains how our data access APIs work.
- I find it easy to find data scientists outside my team who have attempted similar analyses to those I’m interested in.
- For data outside my team, corrupt data is the largest obstacle I face when performing a data analysis.
- My team understands the importance of meta-data and makes it available to other teams.
- Data I use from outside my team comes with meta-data for assessing its completeness and accuracy.
- I regularly create dashboards for monitoring data quality.
- My team uses metrics to assess our data quality.
Introduction
Conclusions
- Data is modern software
- We need to revisit software engineering and computer science in this context.
Thanks!
For more information on these subjects and more you might want to check the following resources.
- twitter: @lawrennd
- podcast: The Talking Machines
- newspaper: Guardian Profile Page
- blog: http://inverseprobability.com


