

Introduction to Machine Learning Systems
[jupyter][google colab][reveal][edit]
Eric Meissner, Andrei Paleyes, Neil D. Lawrence
Venue:Virtual DSA on Friday, Jul 24, 2020
Abstract: This notebook introduces some of the challenges of building machine learning data systems. It will introduce you to concepts around joining of databases together. The storage and manipulation of data is at the core of machine learning systems and data science. The goal of this notebook is to introduce the reader to these concepts, not to authoritatively answer any questions about the state of Nigerian health facilities or Covid19, but it may give you ideas about how to try and do that in your own country.
Nigerian Health Facility Distribution
In this notebook, we explore the question of health facility distribution in Nigeria, spatially, and in relation to population density.
We explore and visualize the question “How does the number of health facilities per capita vary across Nigeria?”
Rather than focussing purely on using tools like pandas to manipulate the data, our focus will be on introducing some concepts from databases.
Machine learning can be summarized as \[ \text{model} + \text{data} \xrightarrow{\text{compute}} \text{prediction} \] and many machine learning courses focus a lot on the model part. But to build a machine learning system in practice, a lot of work must be put into the data part. This notebook gives some pointers on that work and how to think about your machine learning systems design.
Datasets
In this notebook, we download 4 datasets:
- Nigeria NMIS health facility data
- Population data for Administrative Zone 1 (states) areas in Nigeria
- Map boundaries for Nigerian states (for plotting and binning)
- Covid cases across Nigeria (as of May 20, 2020)
But joining these data sets together is just an example. As another example, you could think of SafeBoda, a ride-hailing app that’s available in Lagos and Kampala. As well as looking at the health examples, try to imagine how SafeBoda may have had to design their systems to be scalable and reliable for storing and sharing data.
Imports, Installs, and Downloads
First, we’re going to download some particular python libraries for dealing with geospatial data. We’re dowloading geopandas which will help us deal with ‘shape files’ that give the geographical lay out of Nigeria. We also need pygeos for indexing.
import importlib.utilcmd = install_command('geopandas')%system {cmd}cmd = install_command('pygeos')%system {cmd}Setup
notutils
This small package is a helper package for various notebook utilities used below.
The software can be installed using
cmd = install_command('notutils')%system {cmd}from the command prompt where you can access your python installation.
The code is also available on GitHub: https://github.com/lawrennd/notutils
Once notutils is installed, it can be imported in the usual manner.
import notutilspods
In Sheffield we created a suite of software tools for ‘Open Data Science’. Open data science is an approach to sharing code, models and data that should make it easier for companies, health professionals and scientists to gain access to data science techniques.
You can also check this blog post on Open Data Science.
The software can be installed using
cmd = install_command('pods')%system {cmd}from the command prompt where you can access your python installation.
The code is also available on GitHub: https://github.com/lawrennd/ods
Once pods is installed, it can be imported in the usual manner.
import podsmlai
The mlai software is a suite of helper functions for teaching and demonstrating machine learning algorithms. It was first used in the Machine Learning and Adaptive Intelligence course in Sheffield in 2013.
The software can be installed using
cmd = install_command('mlai')%system {cmd}from the command prompt where you can access your python installation.
The code is also available on GitHub: https://github.com/lawrennd/mlai
Once mlai is installed, it can be imported in the usual manner.
import mlai
from mlai import plot
Databases and Joins
The main idea we will be working with in this practical is the ‘join’. A join does exactly what it sounds like, it combines two database tables.
You may have already started to look at data structures and learning about pandas which is a great way of storing and structuring your data set to make it easier to plot and manipulate your data.
Pandas is great for the data scientist to analyze data because it makes many operations easier. But it is not so good for building the machine learning system. In a machine learning system, you may have to handle a lot of data. Even if you start with building a system where you only have a few customers, perhaps you build an online taxi system (like SafeBoda) for Kampala. Maybe you will have 50 customers. Then maybe your system can be handled with some python scripts and pandas.
Scaling ML Systems
But what if you are successful? What if everyone in Kampala wants to use your system? There are 1.5 million people in Kampala and maybe 100,000 Boda Boda drivers.1
What if you are even more succesful? What if everyone in Lagos wants to use your system? There are around 20 million people in Lagos … and maybe as many Okada[^okada] drivers as people in Kampala!
[^okada] In Lagos the Boda Boda is called an Okada.
We want to build safe and reliable machine learning systems. Building them from pandas and python is about as safe and reliable as taking six children to school on a boda boda.
To build a reliable system, we need to turn to databases. In this notebook we’ll be focusing on SQL databases and how you bring together different streams of data in a Machine Learning System.
In a machine learning system, you will need to bring different data sets together. In database terminology this is known as a ‘join’. You have two different data sets, and you want to join them together. Just like you can join two pieces of metal using a welder, or two pieces of wood with screws.
But instead of using a welder or screws to join data, we join it using columns of the data. We can join data together using people’s names. One database may contain where people live, another database may contain where they go to school. If we join these two databases, we can have a database which shows where people live and where they got to school.
In the notebook, we will join some data about where the health centers are in Nigeria with data about where there have been cases of Covid19. There are other challenges in the ML System Design that are not going to be covered here. They include how to update the databases and how to control access to the databases from different users (boda boda drivers, riders, administrators etc).
Nigeria NMIS Data
As an example data set we will use Nigerian Millennium Development Goals Information System Health Facility (The Office of the Senior Special Assistant to the President on the Millennium Development Goals (OSSAP-MDGs) and Columbia University, 2014). It can be found here https://energydata.info/dataset/nigeria-nmis-education-facility-data-2014.
Taking from the information on the site,
The Nigeria MDG (Millennium Development Goals) Information System – NMIS health facility data is collected by the Office of the Senior Special Assistant to the President on the Millennium Development Goals (OSSAP-MDGs) in partner with the Sustainable Engineering Lab at Columbia University. A rigorous, geo-referenced baseline facility inventory across Nigeria is created spanning from 2009 to 2011 with an additional survey effort to increase coverage in 2014, to build Nigeria’s first nation-wide inventory of health facility. The database includes 34,139 health facilities info in Nigeria.
The goal of this database is to make the data collected available to planners, government officials, and the public, to be used to make strategic decisions for planning relevant interventions.
For data inquiry, please contact Ms. Funlola Osinupebi, Performance Monitoring & Communications, Advisory Power Team, Office of the Vice President at funlola.osinupebi@aptovp.org
To learn more, please visit http://csd.columbia.edu/2014/03/10/the-nigeria-mdg-information-system-nmis-takes-open-data-further/
Suggested citation: Nigeria NMIS facility database (2014), the Office of the Senior Special Assistant to the President on the Millennium Development Goals (OSSAP-MDGs) & Columbia University
For ease of use we’ve packaged this data set in the pods library
data = pods.datasets.nigeria_nmis()['Y']
data.head()
Alternatively, you can access the data directly with the following commands.
import urllib.request
urllib.request.urlretrieve('https://energydata.info/dataset/f85d1796-e7f2-4630-be84-79420174e3bd/resource/6e640a13-cab4-457b-b9e6-0336051bac27/download/healthmopupandbaselinenmisfacility.csv', 'healthmopupandbaselinenmisfacility.csv')

import pandas as pd
data = pd.read_csv('healthmopupandbaselinenmisfacility.csv')
Once it is loaded in the data can be summarized using the describe method in pandas.
data.describe()We can also find out the dimensions of the dataset using the shape property.
data.shapeDataframes have different functions that you can use to explore and understand your data. In python and the Jupyter notebook it is possible to see a list of all possible functions and attributes by typing the name of the object followed by .<Tab> for example in the above case if we type data.<Tab> it show the columns available (these are attributes in pandas dataframes) such as num_nurses_fulltime, and also functions, such as .describe().
For functions we can also see the documentation about the function by following the name with a question mark. This will open a box with documentation at the bottom which can be closed with the x button.
data.describe?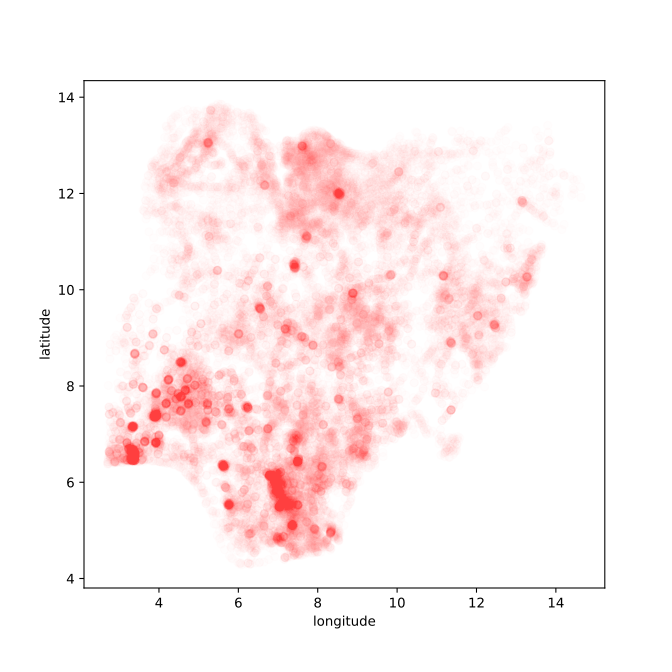
Figure: Location of the over thirty-four thousand health facilities registered in the NMIS data across Nigeria. Each facility plotted according to its latitude and longitude.
hospital_data = dataAdministrative Zone Geo Data
A very common operation is the need to map from locations in a country to the administrative regions. If we were building a ride sharing app, we might also want to map riders to locations in the city, so that we could know how many riders we had in different city areas.
Administrative regions have various names like cities, counties, districts, or states. These conversions for the administrative regions are important for getting the right information to the right people.
Of course, if we had a knowledgeable Nigerian, we could ask her about what the right location for each of these health facilities is, which state is it in? But given that we have the latitude and longitude, we should be able to find out automatically what the different states are.
This is where “geo” data becomes important. We need to download a dataset that stores the location of the different states in Nigeria. These files are known as ‘outline’ files. Because they draw the different states of different countries in outline.
There are special databases for storing this type of information, the database we are using is in the gdb or GeoDataBase format. It comes in a zip file. Let’s download the outline files for the Nigerian states. They have been made available by the Humanitarian Data Exchange, you can also find other states data from the same site.
Nigerian Administrative Zones Data
For ease of use we’ve packaged this data set in the pods library
data = pods.datasets.nigerian_administrative_zones()['Y']
data.set_index("admin1Name_en", inplace=True)
data.head()
Alternatively you can access the data directly with the following commands.
import zipfile

admin_zones_url = 'https://data.humdata.org/dataset/81ac1d38-f603-4a98-804d-325c658599a3/resource/0bc2f7bb-9ff6-40db-a569-1989b8ffd3bc/download/nga_admbnda_osgof_eha_itos.gdb.zip'
_, msg = urllib.request.urlretrieve(admin_zones_url, 'nga_admbnda_osgof_eha_itos.gdb.zip')
with zipfile.ZipFile('/content/nga_admbnda_osgof_eha_itos.gdb.zip', 'r') as zip_ref:
    zip_ref.extractall('/content/nga_admbnda_osgof_eha_itos.gdb')

import geopandas as gpd
import fiona

states_file = "./nga_admbnda_osgof_eha_itos.gdb/nga_admbnda_osgof_eha_itos.gdb/nga_admbnda_osgof_eha_itos.gdb/nga_admbnda_osgof_eha_itos.gdb/"

layers = fiona.listlayers(states_file)
data = gpd.read_file(states_file, layer=1)
data.crs = "EPSG:4326"
data = data.set_index('admin1Name_en')
Figure: Border locations for the thirty-six different states of Nigeria.
zones_gdf = data.reset_index()Now we have this data of the outlines of the different states in Nigeria.
The next thing we need to know is how these health facilities map onto different states in Nigeria. Without “binning” facilities somehow, it’s difficult to effectively see how they are distributed across the country.
We do this by finding a “geo” dataset that contains the spatial outlay of Nigerian states by latitude/longitude coordinates. The dataset we use is of the “gdb” (GeoDataBase) type and comes as a zip file. We don’t need to worry much about this datatype for this notebook, only noting that geopandas knows how to load in the dataset, and that it contains different “layers” for the same map. In this case, each layer is a different degree of granularity of the political boundaries, with layer 0 being the whole country, 1 is by state, or 2 is by local government. We’ll go with a state level view for simplicity, but as an excercise you can change it to layer 2 to view the distribution by local government.
Once we have these MultiPolygon objects that define the boundaries of different states, we can perform a spatial join (sjoin) from the coordinates of individual health facilities (which we already converted to the appropriate Point type when moving the health data to a GeoDataFrame.)
Joining a GeoDataFrame
The first database join we’re going to do is a special one, it’s a ‘spatial join’. We’re going to join the locations of the hospitals with their states.
This join is unusual because it requires some mathematics to get right. The outline files give us the borders of the different states in latitude and longitude, the health facilities have given locations in the country.
A spatial join involves finding out which state each health facility belongs to. Fortunately, the mathematics you need is already programmed for you in GeoPandas. That means all we need to do is convert our pandas dataframe of health facilities into a GeoDataFrame which allows us to do the spatial join.
First, we convert the hospital data to a geopandas data frame.
import geopandas as gpdgeometry = gpd.points_from_xy(hospital_data.longitude, hospital_data.latitude)
hosp_gdf = gpd.GeoDataFrame(hospital_data,
geometry=geometry)
hosp_gdf.crs = "EPSG:4326"There are some technial details here: the crs refers to the coordinate system in use by a particular GeoDataFrame. EPSG:4326 is the standard coordinate system of latitude/longitude.
Your First Join: Converting GPS Coordinates to States
Now we have the data in the GeoPandas format, we can start converting into states. We will use the fiona library for reading the right layers from the files. Before we do the join, lets plot the location of health centers and states on the same map.
nigeria_gdf = zones_gdf.dissolve()
if nigeria_gdf.crs is None:
    nigeria_gdf.crs = "EPSG:4326"
Figure: The outline of the thirty-six different states of nigeria with the location sof the health centers plotted on the map.
Performing the Spatial Join
We’ve now plotted the different health center locations across the states. You can clearly see that each of the dots falls within a different state. For helping the visualization, we’ve made the dots somewhat transparent (we set the alpha in the plot). This means that we can see the regions where there are more health centers, you should be able to spot where the major cities in Nigeria are given the increased number of health centers in those regions.
Of course, we can now see by eye, which of the states each of the health centers belongs to. But we want the computer to do our join for us. GeoPandas provides us with the spatial join. Here we’re going to do a left or outer join.
from geopandas.tools import sjoinWe have two GeoPandas data frames, hosp_gdf and zones_gdf. Let’s have a look at the columns the contain.
hosp_gdf.columnsWe can see that this is the GeoDataFrame containing the information about the hospital. Now let’s have a look at the zones_gdf data frame.
zones_gdf.columnsYou can see that this data frame has a different set of columns. It has all the different administrative regions. But there is one column name that overlaps. We can find it by looking for the intersection between the two sets.
set(hosp_gdf.columns).intersection(set(zones_gdf.columns))Here we’ve converted the lists of columns into python ‘sets’, and then looked for the intersection. The join will occur on the intersection between these columns. It will try and match the geometry of the hospitals (their location) to the geometry of the states (their outlines). This match is done in one line in GeoPandas.
We’re having to use GeoPandas because this join is a special one based on geographical locations, if the join was on customer name or some other discrete variable, we could do the join in pandas or directly in SQL.
hosp_state_joined = sjoin(hosp_gdf, zones_gdf, how='left')The intersection of the two data frames indicates how the two data frames will be joined (if there’s no intersection, they can’t be joined). It’s like indicating the two holes that would need to be bolted together on two pieces of metal. If the holes don’t match, the join can’t be done. There has to be an intersection.
But what will the result look like? Well, the join should be the ‘union’ of the two data frames. We can have a look at what the union should be by (again) converting the columns to sets.
set(hosp_gdf.columns).union(set(zones_gdf.columns))That gives a list of all the columns (notice that ‘geometry’ only appears once).
Let’s check that’s what the join command did, by looking at the columns of our new data frame, hosp_state_joined. Notice also that there’s a new column: index_right. The two original data bases had separate indices. The index_right column represents the index from the zones_gdf, which is the Nigerian state.
set(hosp_state_joined.columns)Great! They are all there! We have completed our join. We had two separate data frames with information about states and information about hospitals. But by performing an ‘outer’ or a ‘left’ join, we now have a single data frame with all the information in the same place! Let’s have a look at the first frew entries in the new data frame.
hosp_state_joined.head()SQL Database
Our first join was a special one, because it involved spatial data. That meant using the special gdb format and the GeoPandas tool for manipulating that data. But we’ve now saved our updated data in a new file.
To do this, we use the command line utility that comes standard for SQLite database creation. SQLite is a simple database that’s useful for playing with database commands on your local machine. For a real system, you would need to set up a server to run the database. The server is a separate machine with the job of answering database queries. SQLite pretends to be a proper database but doesn’t require us to go to the extra work of setting up a server. Popular SQL server software includes MariaDB which is open source, or Microsoft’s SQL Server.
A typical machine learning installation might have you running a database from a cloud service (such as AWS, Azure or Google Cloud Platform). That cloud service would host the database for you, and you would pay according to the number of queries made.
Many start-up companies were formed on the back of a MySQL server hosted on top of AWS. Although since MySQL was sold to Sun, and then passed on to Oracle, the open source community has turned its attention to MariaDB, here’s the AWS instructions on how to set up MariaDB.
If you were designing your own ride hailing app, or any other major commercial software you would want to investigate whether you would need to set up a central SQL server in one of these frameworks.
Today though, we’ll just stick to SQLite which gives you a sense of the database without the time and expense of setting it up on the cloud. As well as showing you the SQL commands (which is often what’s used in a production ML system) we’ll also give the equivalent pandas commands, which would often be what you would use when you’re doing data analysis in python and Jupyter.
Create the SQLite Database
The beautiful thing about SQLite is that it allows us to play with SQL without going to the work of setting up a proper SQL server. Creating a data base in SQLite is as simple as writing a new file. To create the database, we’ll first write our joined data to a CSV file, then we’ll use a little utility to convert our hospital database into a SQLite database.
hosp_state_joined.to_csv("hospitals_zones_joined.csv")cmd = install_command('csv-to-sqlite')%system {cmd}!csv-to-sqlite -f hospitals_zones_joined.csv -t full -o db.sqliteRather than being installed on a separate server, SQLite simply stores the database locally in a file called db.sqlite.
In the database there can be several ‘tables’. Each table can be thought of as like a separate dataframe. The table name we’ve just saved is ‘hospitals_zones_joined’.
Accessing the SQL Database
Now that we have a SQL database, we can create a connection to it and query it using SQL commands. Let’s try to simply select the data we wrote to it, to make sure it’s the same.
Start by making a connection to the database. This will often be done via remote connections, but for this example we’ll connect locally to the database using the filepath directly.
To access a data base, the first thing that is made is a connection. Then SQL is used to extract the information required. A typical SQL command is SELECT. It allows us to extract rows from a given table. It operates a bit like the .head() method in pandas, it will return the first N rows (by default the .head() command returns the first 5 rows, but you can set N to whatever you like. Here we’ve included a default value of 5 to make it match the pandas command.
We do this using an execute command on the connection.
Typically, its good software engineering practice to ‘wrap’ the database command in some python code. This allows the commands to be maintained. You will also be asked to do this in your final assessment, including re-writing some of the code - pay attention to the slight syntax differences and multi-statement queries.Below we wrap the SQL command
SELECT * FROM table_name LIMIT Nin python code. This SQL command selects the first N entries from a given database called table_name.
We can pass the table_name and number of rows, n, to the python command.
conn = create_connection("db.sqlite")Now that we have a connection, we can write a command and pass it to the database.
To access a data base, the first thing that is made is a connection. Then SQL is used to extract the information required. A typical SQL command is SELECT. It allows us to extract rows from a given table. It operates a bit like the .head() method in pandas, it will return the first N rows (by default the .head() command returns the first 5 rows, but you can set N to whatever you like. Here we’ve included a default value of 5 to make it match the pandas command.
The python library, sqlite3, allows us to access the SQL database directly from python.
Let’s have a go at calling the command to extract the first three facilities from our health center database. Let’s try creating a function that does the same thing the pandas .head() method does so we can inspect our database.
def head(conn, table, n=5):
  rows = select_top(conn, table, n)
  for r in rows:
      print(r)
head(conn, "hospitals_zones_joined")Great! We now have the database in and some python functions that operate on the data base by wrapping SQL commands.
We will return to the SQL command style after download and add the other datasets to the database using a combination of pandas and the database utilities.
Our next task will be to introduce data on COVID19 so that we can join that to our other data sets.
Covid Data
Now we have the health data, we’re going to combine it with data about COVID-19 cases in Nigeria over time. This data is kindly provided by Africa open COVID-19 data working group, which Elaine Nsoesie has been working with. The data is taken from Twitter, and only goes up until May 2020.
They provide their data in GitHub. We can access the cases we’re interested in from the following URL.
https://raw.githubusercontent.com/dsfsi/covid19africa/master/data/line_lists/line-list-nigeria.csv
For convenience, we’ll load the data into pandas first, but our next step will be to create a new SQLite table containing the data. Then we’ll join that table to our existing tables.
Nigerian COVID Data
At the beginning of the COVID-19 outbreak, the Consortium for African COVID-19 Data formed to bring together data from across the African continent on COVID-19 cases (Marivate et al., 2020). These cases are recorded in the following GitHub repository: https://github.com/dsfsi/covid19africa.
For ease of use we’ve packaged this data set in the pods library
import podsdata = pods.datasets.nigerian_covid()['Y']
data.head()Alternatively, you can access the data directly with the following commands.
import urllib.request
import pandas as pd

urllib.request.urlretrieve('https://raw.githubusercontent.com/dsfsi/covid19africa/master/data/line_lists/line-list-nigeria.csv', 'line-list-nigeria.csv')
data = pd.read_csv('line-list-nigeria.csv', parse_dates=['date',
                                                         'date_confirmation',
                                                         'date_admission_hospital',
                                                         'date_onset_symptoms',
                                                         'death_date'])
Once it is loaded in the data can be summarized using the describe method in pandas.
data.describe()Figure: Evolution of COVID-19 cases in Nigeria.
covid_data=data
covid_data.to_csv('cases.csv')
Now we convert this CSV file we’ve downloaded into a new table in the database file.
We can do this, again, with the csv-to-sqlite script.
!csv-to-sqlite -f cases.csv -t full -o db.sqlitePopulation Data
Now we have information about COVID cases, and we have information about how many health centers and how many doctors and nurses there are in each health center. But unless we understand how many people there are in each state, then we cannot make decisions about where they may be problems with the disease.
If we were running our ride hailing service, we would also need information about how many people there were in different areas, so we could understand what the demand for the boda boda rides might be.
To access the number of people we can get population statistics from the Humanitarian Data Exchange.
We also want to have population data for each state in Nigeria, so that we can see attributes like whether there are zones of high health facility density but low population density.
import urllib

pop_url = "https://data.humdata.org/dataset/a7c3de5e-ff27-4746-99cd-05f2ad9b1066/resource/d9fc551a-b5e4-4bed-9d0d-b047b6961817/download/nga_admpop_adm1_2020.csv"
_, msg = urllib.request.urlretrieve(pop_url,"nga_admpop_adm1_2020.csv")
data = pd.read_csv("nga_admpop_adm1_2020.csv")
To do joins with this data, we must first make sure that the columns have the right names. The name should match the same name of the column in our existing data. So we reset the column names, and the name of the index, as follows.
data.dropna(axis=0, how="all", inplace=True)
data.dropna(axis=1, how="all", inplace=True)
data.rename(columns = {"ADM0_NAME" : "admin0Name_en",
                       "ADM0_PCODE" : "admin0Pcode",
                       "ADM1_NAME" : "admin1Name_en",
                       "ADM1_PCODE" : "admin1Pcode",
                       "T_TL" : "population"},
            inplace=True)
data["admin0Name_en"] = data["admin0Name_en"].str.title()
data["admin1Name_en"] = data["admin1Name_en"].str.title()

data = data.set_index("admin1Name_en")
data = pods.datasets.nigerian_population()["Y"]data.head()pop_data=dataWhen doing this for real world data, you should also make sure that the names used in the rows are the same across the different data bases. For example, has someone decided to use an abbreviation for ‘Federal Capital Territory’ and set it as ‘FCT’. The computer won’t understand these are the same states, and if you do a join with such data, you can get duplicate entries or missing entries. This sort of thing happens a lot in real world data and takes a lot of time to sort out. Fortunately, in this case, the data is well curated, and we don’t have these problems.
Save to database file
The next step is to add this new CSV file as an additional table in our database.
Loading the Population Data into the SQLite Database
We can load the data into the SQLite database using the script as before.
pop_data.to_csv('pop_data.csv')!csv-to-sqlite -f pop_data.csv -t full -o db.sqliteThanks!
For more information on these subjects and more you might want to check the following resources.
- company: Trent AI
- book: The Atomic Human
- twitter: @lawrennd
- podcast: The Talking Machines
- newspaper: Guardian Profile Page
- blog: http://inverseprobability.com