The Data Science Landscape
LT2, William Gates Building
Course Overview
Introduction
An Emerging Field
- I’ve never seen data science done well, but I’ve seen places where it’s done better.
- Reddit https://www.reddit.com/r/CST_ADS/
Week 4
- The Data Science Landscape. Lecturer: Neil D. Lawrence 2024-11-01
- AI and Data Science. Lecturer: Neil D. Lawrence 2024-11-04
- Systems and Data Oriented Architecture. Lecturer: Christian Cabrera 2024-11-06
Lab Session One 2024-11-05 (Review and Refresher) Practical 1: 2024-11-07 Access
Week 5
- AI Deployment Challenges. Lecturer: Christian Cabrera 2024-11-08
- Assess. Lecturer: Neil D. Lawrence 2024-11-11
- Visualisation. Lecturer: Neil D. Lawrence 2024-11-13
Practical 2: 2024-11-12 Access and Assess (also hand in Practical 1 & Practical One Check)
Week 6
- Introduction to Statistical Learning: Neil D. Lawrence 2024-11-15
- Generalised Linear Models: Neil D. Lawrence 2024-11-18
Practical 3: 2024-11-19 Assess and Address (also hand in Practical 2 & Check) Practical 4: 2024-11-21 Address (also hand in Practical 3 & Check)
Week 7
- Summary and Assignment: 2024-11-24
Week 8
- Assignment hand in 2024-12-03
Assessment
- Available in Moodle.
- Will be able to complete as we teach.
- After each lab session is complete, progress in assessment.
- Revisit your questions to “refactor” your code before submission.
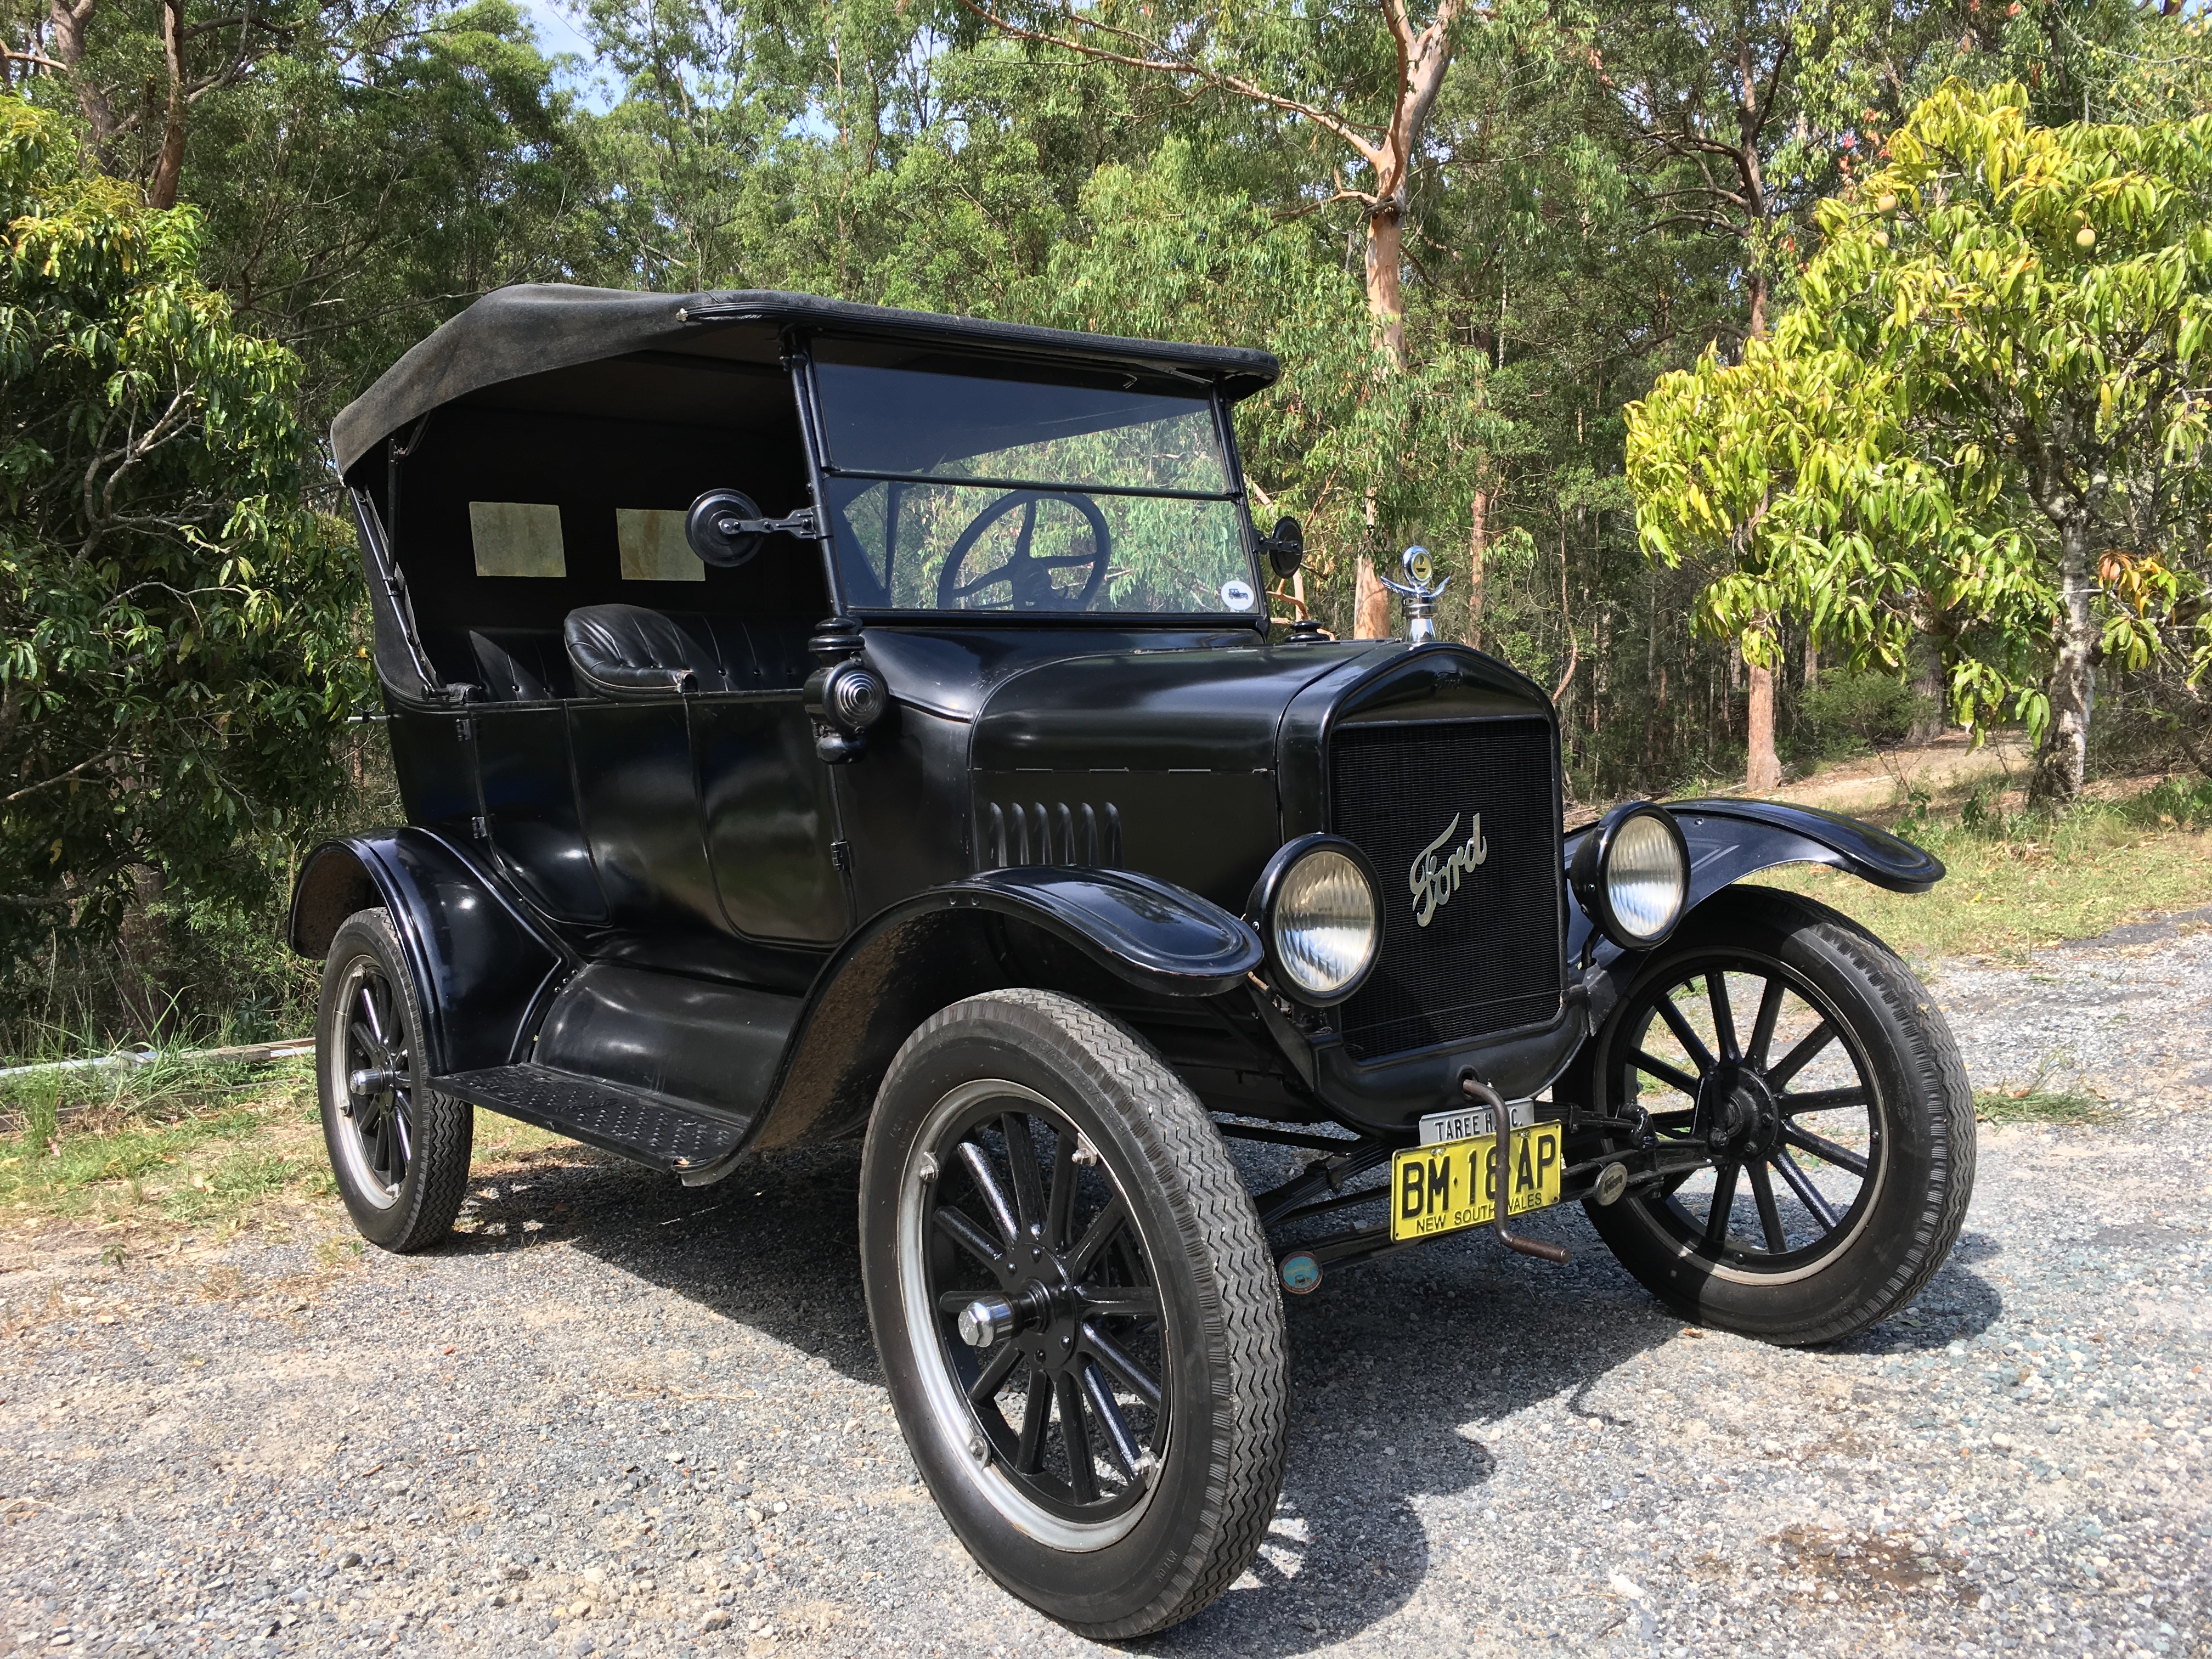
Henry Ford’s Faster Horse
There are three types of lies: lies, damned lies and statistics
??
There are three types of lies: lies, damned lies and statistics
Arthur Balfour 1848-1930
There are three types of lies: lies, damned lies and statistics
Arthur Balfour 1848-1930
There are three types of lies: lies, damned lies and ‘big data’
Neil Lawrence 1972-?
Mathematical Statistics

‘Mathematical Data Science’


O M D P C F B V
H G J Q Z Y X K W

Bauby and Shannon

|

|
|
|
|

|
|
|
bits/min
|
billions
|
2000
|
6
|
|
billion
calculations/s |
~100
|
a billion
|
a billion
|
|
embodiment
|
20 minutes
|
5 billion years
|
15 trillion years
|
Heider and Simmel (1944)
Evolved Relationship with Information
New Flow of Information
Evolved Relationship
Evolved Relationship
Evolved Relationship
Data Science as Debugging
- Analogies: For Software Engineers describe data science as debugging.
80/20 in Data Science
- Anecdotally for a given challenge
- 80% of time is spent on data wrangling.
- 20% of time spent on modelling.
- Many companies employ ML Engineers focussing on models not data.
Lessons
- When you begin an analysis behave as a debugger
- Write test code as you go.
- document tests … make them accessible.
- Be constantly skeptical.
- Develop deep understanding of best tools.
- Share your experience of challenges, have others review work
Lessons
- When managing a data science process.
- Don’t deploy standard agile development. Explore modifications e.g. Kanban
- Don’t leave data scientist alone to wade through mess.
- Integrate the data analysis with other team activities
- Have software engineers and domain experts work closely with data scientists
The Fynesse Framework
- Access
- Assess
- Address
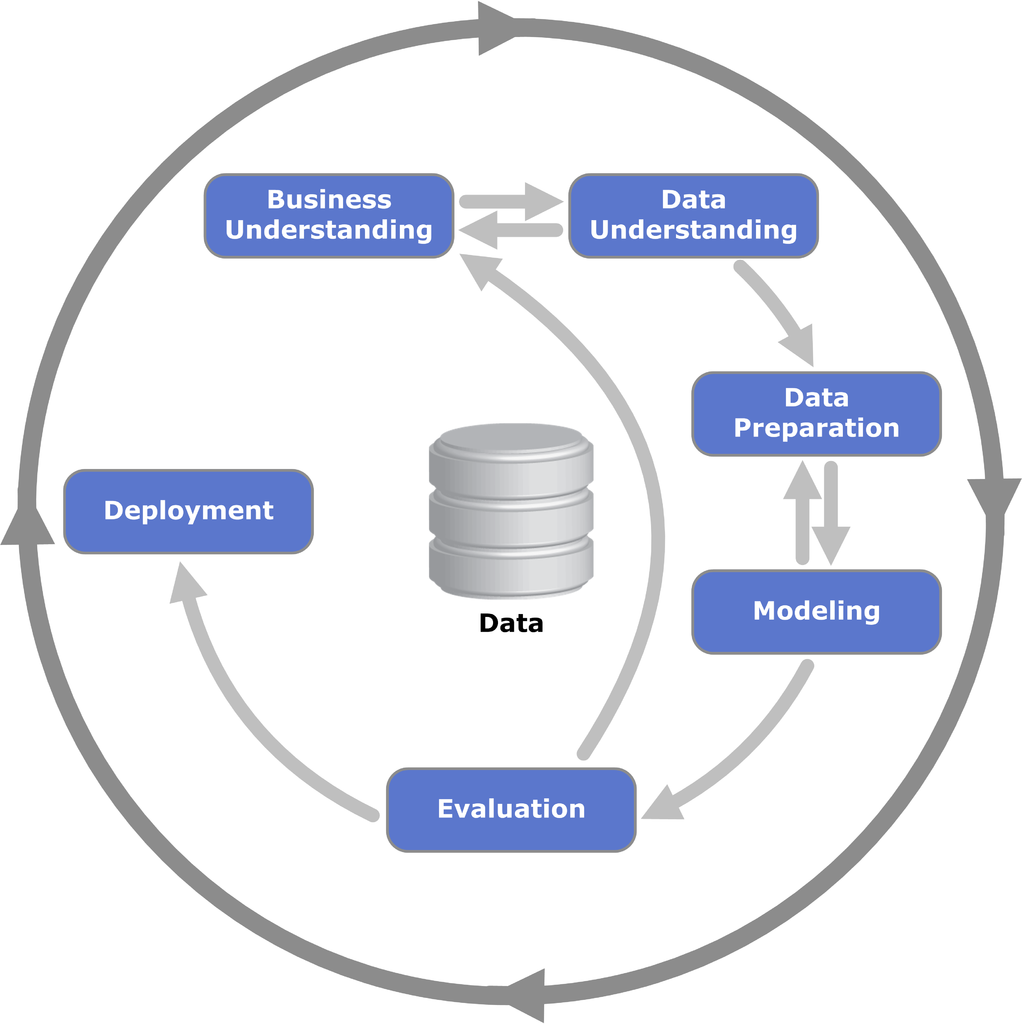
CRISP-DM
Google Trends
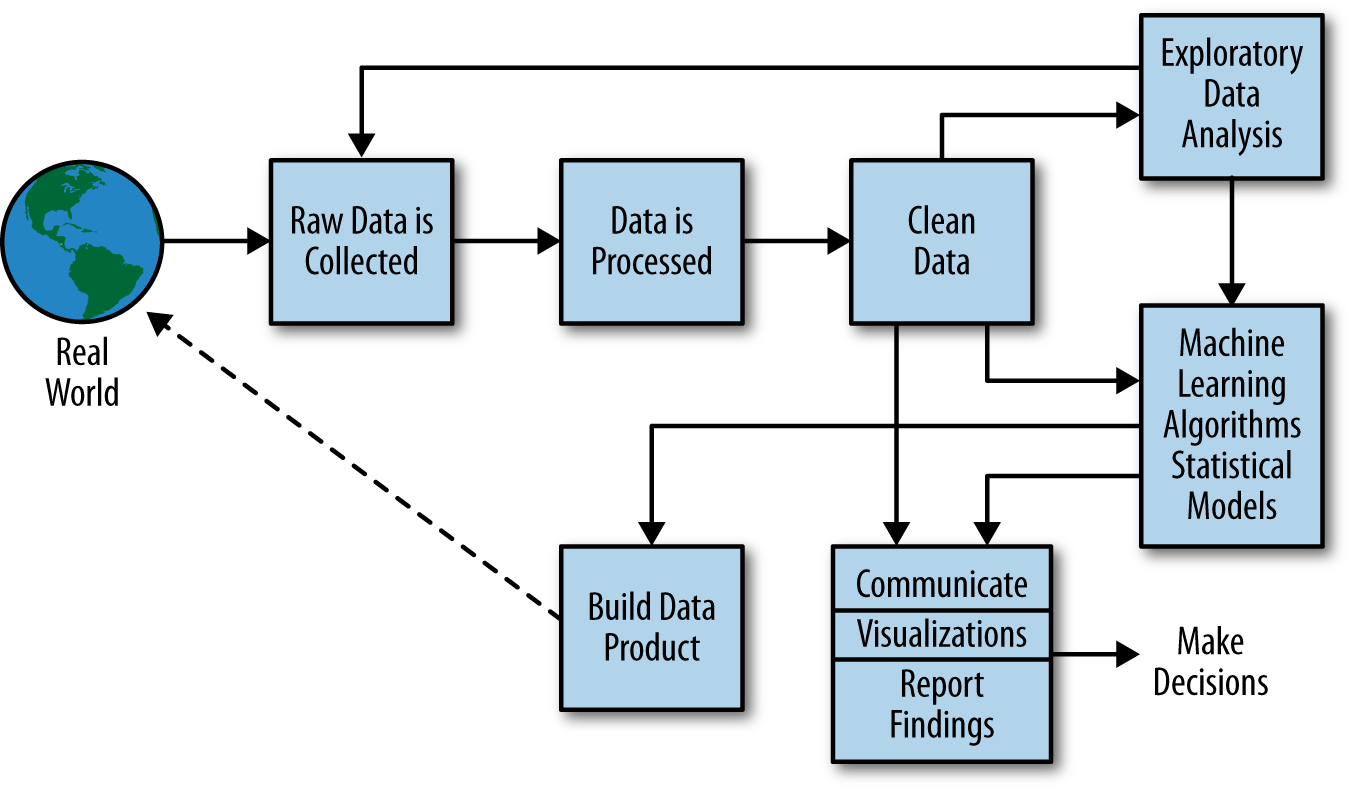
More generally, a data scientist is someone who knows how to extract meaning from and interpret data, which requires both tools and methods from statistics and machine learning, as well as being human. She spends a lot of time in the process of collecting, cleaning, and munging data, because data is never clean. This process requires persistence, statistics, and software engineering skills—skills that are also necessary for understanding biases in the data, and for debugging logging output from code.
Cathy O’Neil and Rachel Strutt from O’Neill and Schutt (2013)
Experiment, Analyze, Design
A Vision
We don’t know what science we’ll want to do in five years’ time, but we won’t want slower experiments, we won’t want more expensive experiments and we won’t want a narrower selection of experiments.
What do we want?
- Faster, cheaper and more diverse experiments.
- Better ecosystems for experimentation.
- Data oriented architectures.
- Data maturity assessments.
- Data readiness levels.
Ride Sharing: Service Oriented
Ride Sharing: Data Oriented
Ride Sharing: Hypothetical
Inspiration
- Operational data science with:
- Data Science Africa
- Amazon (particularly in supply chain)
- The Royal Society DELVE Group (pandemic advice)
The Fynesse Framework
- Three aspects
- Access - before data is available electronically
- Assess - work that can be done without the question
- Address - giving answers to question at hand
Access
- Work to make data electronically accessible.
- Legal work
- Ethical work
- Extraction of data form where it’s held
- mobile phones, within software ecosystem, physical log books
- Associated with data readiness level C.
Access Case Study: Crash Map Kampala
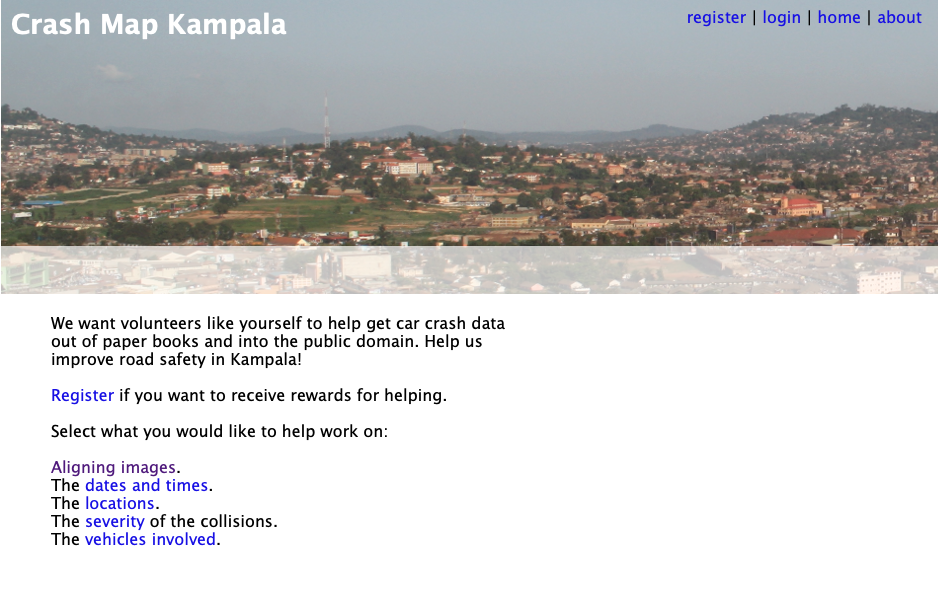
Crash Map Kampala

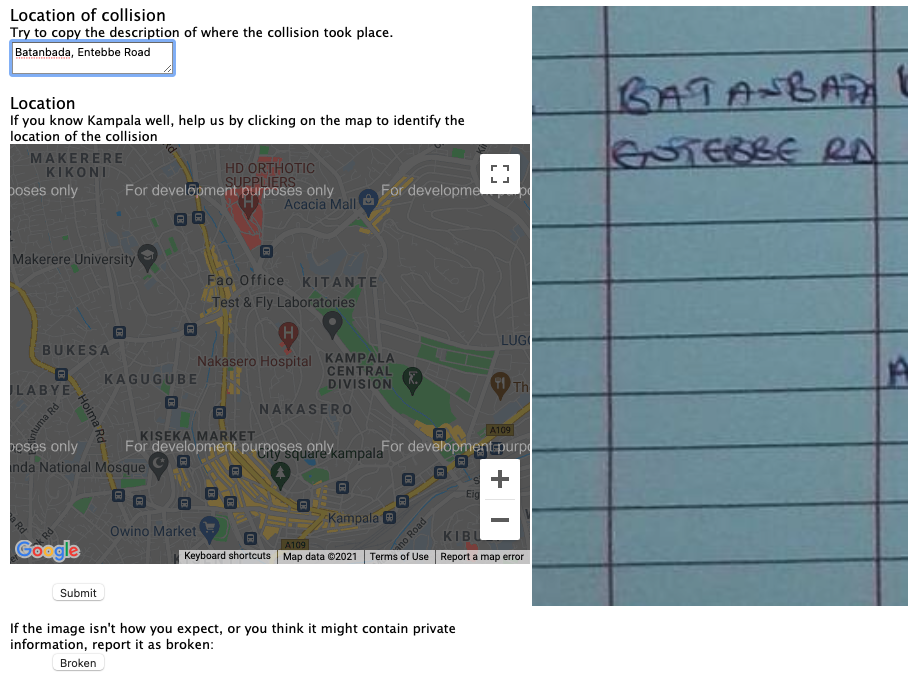
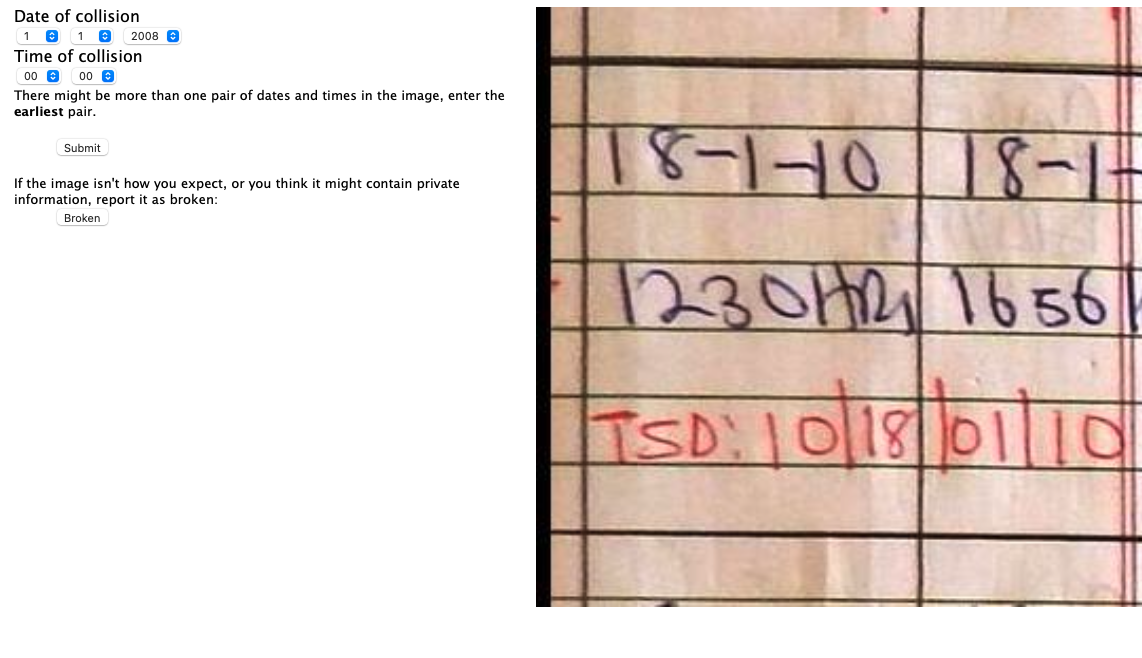
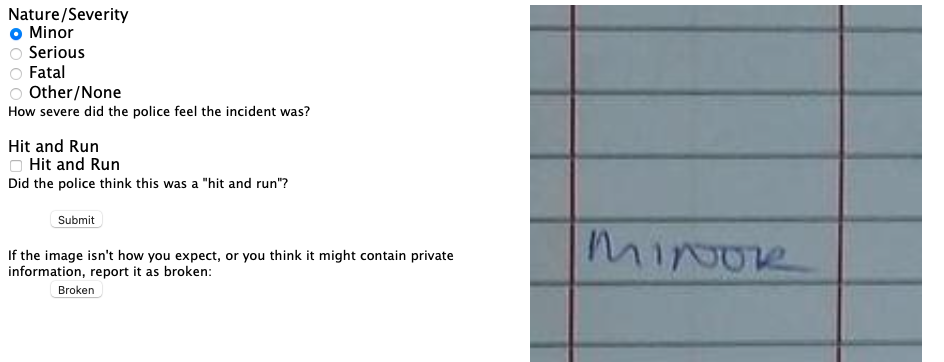
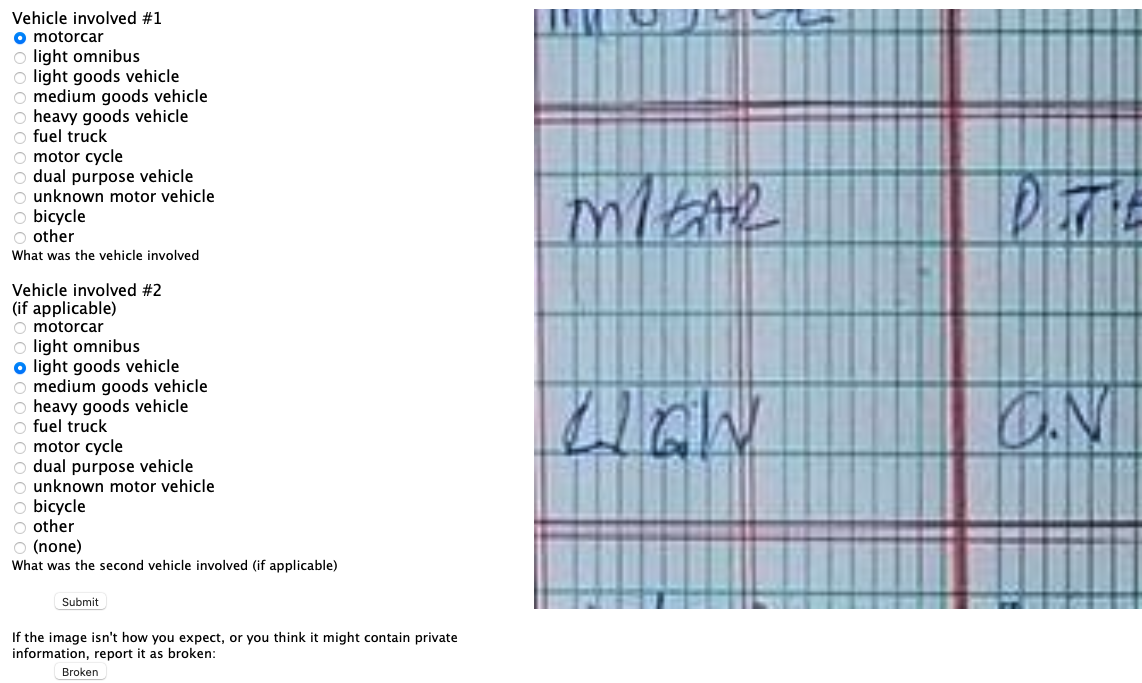
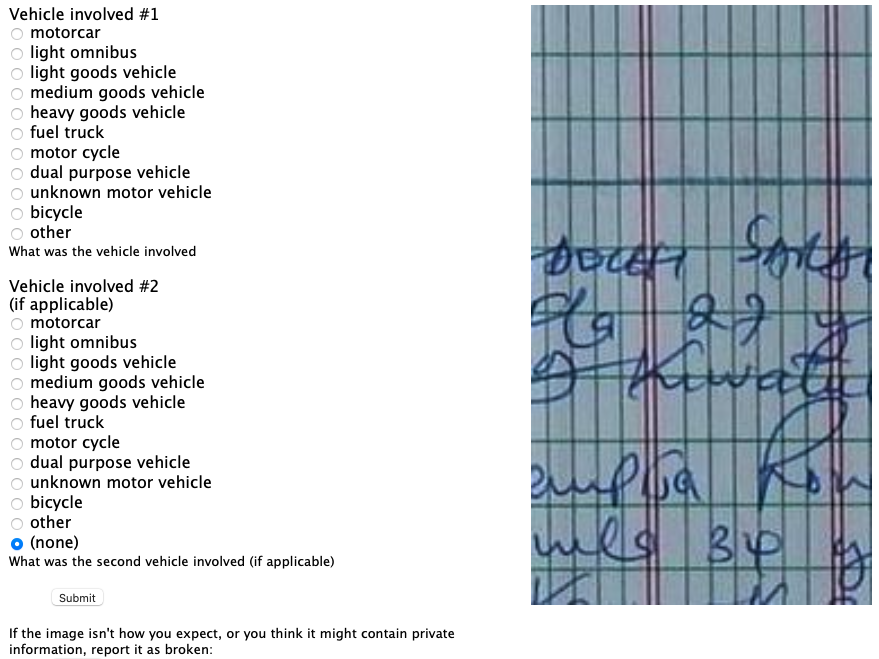
Access Automation
- Digital Transformation
- Post-Digital Transformation
Assess
- Only things you can do without knowing the “question”.
- This ensures assess is reusable across tasks.
- Driven by happenstance data.
- Associated with data readiness level B
Case Study: Text Mining for Covid Misinformation
Table: Portion of data that was annotated.
Initial dataset | 15,354 | 430,075 |
Dataset after Annotation | 3,527 | 4,479 |

Cohen’s kappa inter-annotation used to measure annotator agreement.
Table: Cohen’s kappa agreement scores for the data.
Aspect | 0.69 |
Sentiment | 0.73 |
Misinformation | 0.74 |


Automating Assess
- Automated scheme detection
- Automated data type detection (Valera and Ghahramani (2017))
- The automatic statistician (James Robert Lloyd and Ghahramani. (2014))
- AI for Data Analytics (Nazábal et al. (2020))
- Joyce’s case study gives us also POS tagging for new languages.
AI for Data Analytics
Address
- Address the question.
- Now we bring the context in.
- Could require:
- Confirmatory data analysis
- An ML prediction model
- Visualisation through a dashboard
- An Excel spreadsheet
- Associated with data readiness level A.
Automating Address
- Auto ML
- Automatic Statistician
- Automatic Visualization
AutoML
Fynesse Template
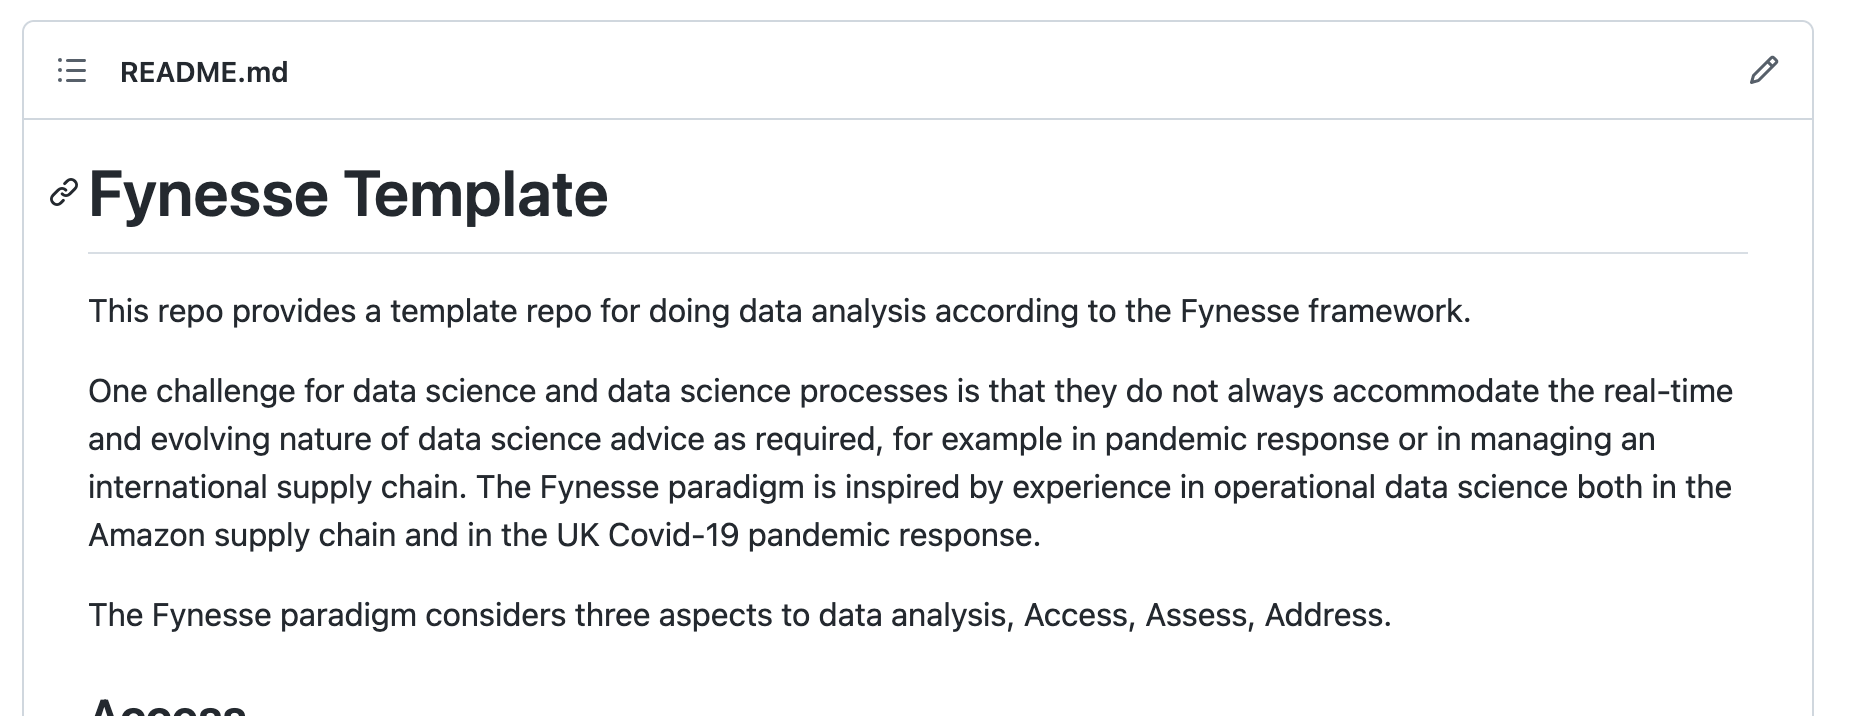
Create Repository from Template

Human Analogue Machine
HAM
What Next?
- Review notebook (covers
pandas, probability and correlation) - Practical 1 (more
pandas, setting up SQL on AWS, uploading data and performing joins with SQL). - Read through assignment to contextualise material.
Further Reading
Chapter 5 of Lawrence (2024)
Chapter 1 of Lawrence (2024)
Chapter 1 of Lawrence (2024)
Chapter 8 of Lawrence (2024)
Thanks!
book: The Atomic Human
twitter: @lawrennd
The Atomic Human pages Le Scaphandre et le papillon (The Diving Bell and the Butterfly) 10–12 , Bauby, Jean Dominique 9–11, 18, 90, 99-101, 133, 186, 212–218, 234, 240, 251–257, 318, 368–369, Shannon, Claude 10, 30, 61, 74, 98, 126, 134, 140, 143, 149, 260, 264, 269, 277, 315, 358, 363, psychological representation 326–329, 344–345, 353, 361, 367, human-analogue machine (HAMs) 343-347, 359-359, 365-368.
podcast: The Talking Machines
newspaper: Guardian Profile Page
blog posts: