
Week 5: A Data Science Process
[reveal]
Abstract:
In this lecture we introduce a data science process: access, assess and address. The process Given the landscape we’ve outlined, in this lecture we will look at the challenges of deploying data science solutions in practice. We categorize them into three groups.
We separated the challenges we face into three groups: (1) paradoxes of the modern data society, (2) quantifying the value of data and (3) privacy loss of control and marginalization. We’ve noted the origins of the paradoxes, speculating that it is based in a form of data (or modelling) inattention bias demonstrated through the Gorilla. We’ve drawn parallels between challenges of rewarding the addition of value and the credit assignment problem in reinforcement learning and we’ve looked at approaches to introduce the voice of marginalized societies and people into the conversation.
Deploying Artificial Intelligence
With the wide availability of new techniques, we are currently creating Artificial Intelligence through combination of machine learning algorithms to form machine learning systems.
This effect is amplified through the growth in sensorics, in particular the movement of cloud computing towards the customer. The barrier between cloud and device is blurring. This phenomenon is sometimes known as fog computing, or computing on the edge.
This presents major new challenges for machine learning systems design. We would like an internet of intelligence but currently our AI systems are fragile. A classical systems approach to design does not handle evolving environments well.
The Fynesse Framework
Here we present a new framework for thinking about data science. The Fynesse framework splits the activities of the data scientist into three aspects, each aspect is represented by a one of three words that highlight different activities that occur within a data science project: we call them access, assess and address.
Before going deeper into the framework, we will contextualize by looking at some other formalizations of the data analysis pipeline.
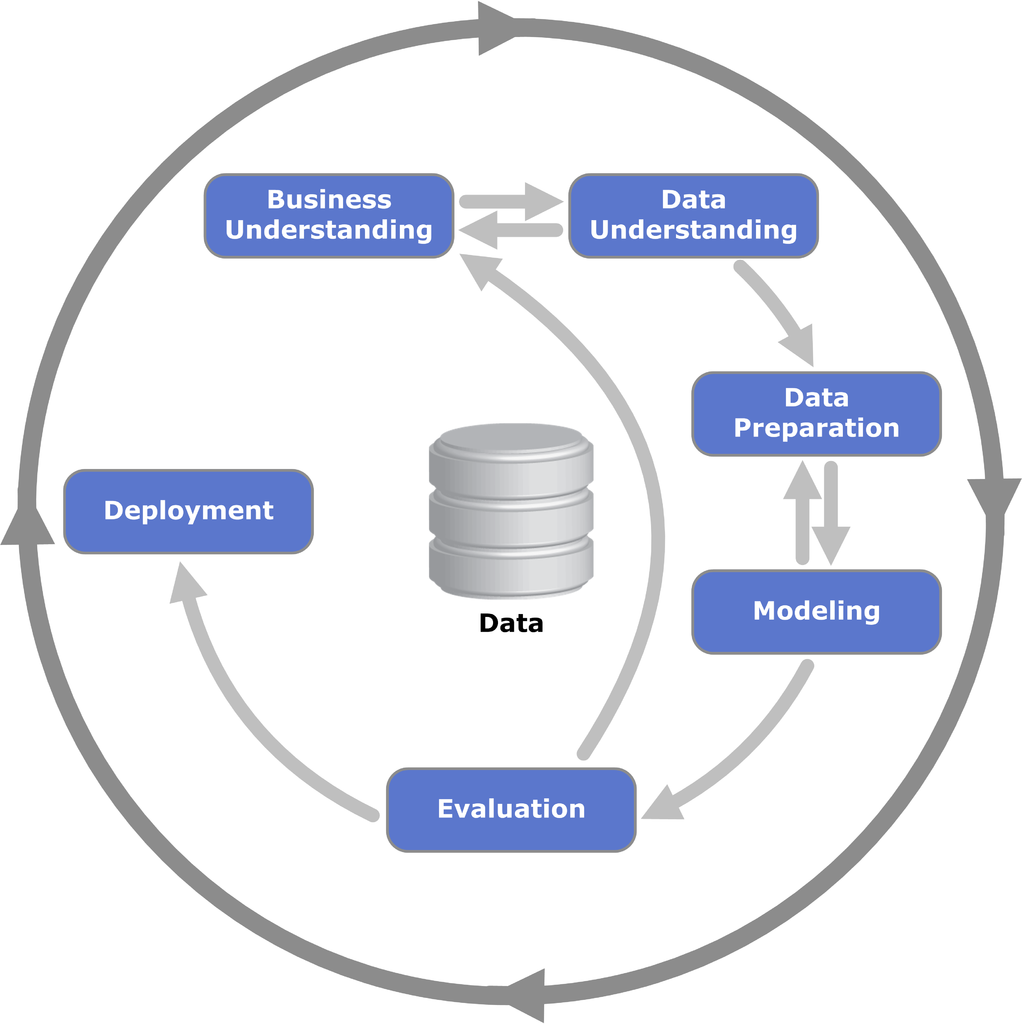

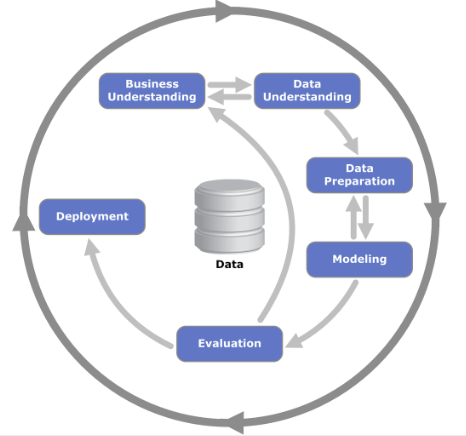
Figure: The CRISP Data Mining Process diagram: it stands for cross industry standard process for data mining. The process was defined in 2000 (Chapman et al. (2000)), well before the modern service-oriented architecture approach to software engineering emerged.
There are formal processes designed for, e.g., data mining, but they are not always appropriate for operational science or continuous deployment. One is the CRISP-DM Chapman et al. (2000) process, which does a nice job of capturing the cyclic nature of these processes but fails to capture the need to build resources that answer questions in real time that occurs in operational science and continuous deployment.
Google Trends
%pip install pytrendsFigure: A Google trends search for ‘data mining’, ‘data science’ as different technological terms give us insight into their popularity over time.
Google trends gives us insight into the interest for different terms over time.
We note that the term data mining is falling somewhat out of favour, and the CRISP-DM data mining process also feels somewhat dated. In particular software engineering has moved on a great deal since it was defined, with modern software engineering more focused on service-oriented architectures. Software design has a pervasive effect on our ability to do data science.
When thinking about the data science process it is important to consider the software architectures that are used in large-scale decision-making systems and understand what it is that they are bring to help solve these problems.
A more modern view from the O’Reilly book Doing Data Science frames the problem as shown in Figure \(\ref{data-science-process-oneil}\).
More generally, a data scientist is someone who knows how to extract meaning from and interpret data, which requires both tools and methods from statistics and machine learning, as well as being human. She spends a lot of time in the process of collecting, cleaning, and munging data, because data is never clean. This process requires persistence, statistics, and software engineering skills—skills that are also necessary for understanding biases in the data, and for debugging logging output from code.
Cathy O’Neil and Rachel Strutt from O’Neil and Schutt (2013)
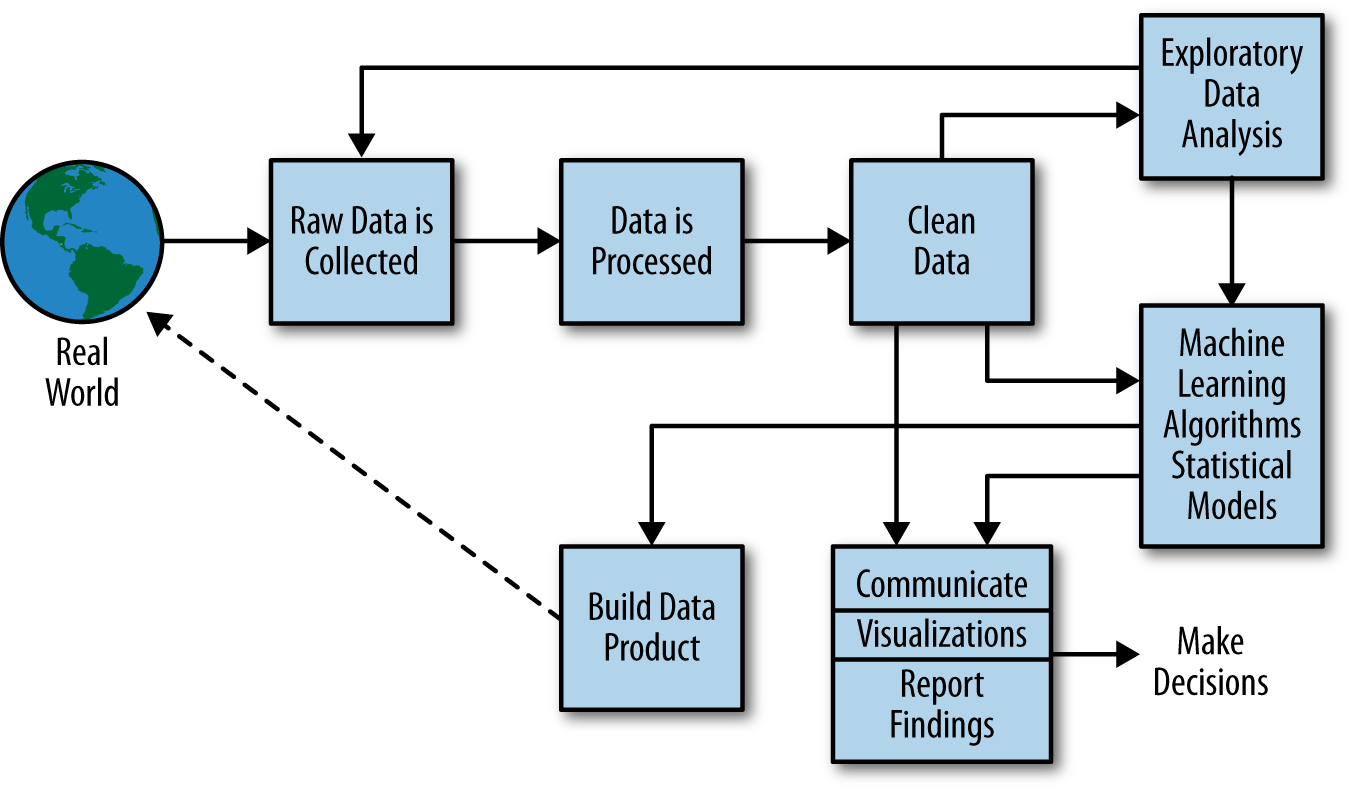
Figure: Another perspective on the data science process, this one from O’Neil and Schutt (2013).
One thing about working in an industrial environment, is the way that short-term thinking actions become important. For example, in Formula One, the teams are working on a two-week cycle to digest information from the previous week’s race and incorporate updates to the car or their strategy.
However, businesses must also think about more medium-term horizons. For example, in Formula 1 you need to worry about next year’s car. So, while you’re working on updating this year’s car, you also need to think about what will happen for next year and prioritize these conflicting needs appropriately.
In the Amazon supply chain, there are equivalent demands. If we accept that an artificial intelligence is just an automated decision-making system. And if we measure in terms of money automatically spent, or goods automatically moved, then Amazon’s buying system is perhaps the world’s largest AI.
Those decisions are being made on short time schedules; purchases are made by the system on weekly cycles. But just as in Formula 1, there is also a need to think about what needs to be done next month, next quarter and next year. Planning meetings are held not only on a weekly basis (known as weekly business reviews), but monthly, quarterly, and then yearly meetings for planning spends and investments.
Amazon is known for being longer term thinking than many companies, and a lot of this is coming from the CEO. One quote from Jeff Bezos that stuck with me was the following.
“I very frequently get the question: ‘What’s going to change in the next 10 years?’ And that is a very interesting question; it’s a very common one. I almost never get the question: ‘What’s not going to change in the next 10 years?’ And I submit to you that that second question is actually the more important of the two – because you can build a business strategy around the things that are stable in time. … [I]n our retail business, we know that customers want low prices, and I know that’s going to be true 10 years from now. They want fast delivery; they want vast selection. It’s impossible to imagine a future 10 years from now where a customer comes up and says, ‘Jeff I love Amazon; I just wish the prices were a little higher,’ [or] ‘I love Amazon; I just wish you’d deliver a little more slowly.’ Impossible. And so the effort we put into those things, spinning those things up, we know the energy we put into it today will still be paying off dividends for our customers 10 years from now. When you have something that you know is true, even over the long term, you can afford to put a lot of energy into it.”
This quote is incredibly important for long term thinking. Indeed, it’s a failure of many of our simulations that they focus on what is going to happen, not what will not happen. In Amazon, this meant that there was constant focus on these three areas, keeping costs low, making delivery fast and improving selection. For example, shortly before I left Amazon moved its entire US network from two-day delivery to one-day delivery. This involves changing the way the entire buying system operates. Or, more recently, the company has had to radically change the portfolio of products it buys in the face of Covid19.
Figure: Experiment, analyze and design is a flywheel of knowledge that is the dual of the model, data and compute. By running through this spiral, we refine our hypothesis/model and develop new experiments which can be analyzed to further refine our hypothesis.
From the perspective of the team that we had in the supply chain, we looked at what we most needed to focus on. Amazon moves very quickly, but we could also take a leaf out of Jeff’s book, and instead of worrying about what was going to change, remember what wasn’t going to change.
We don’t know what science we’ll want to do in five years’ time, but we won’t want slower experiments, we won’t want more expensive experiments and we won’t want a narrower selection of experiments.
As a result, our focus was on how to speed up the process of experiments, increase the diversity of experiments that we can do, and keep the experiments price as low as possible.
The faster the innovation flywheel can be iterated, then the quicker we can ask about different parts of the supply chain, and the better we can tailor systems to answering those questions.
We need faster, cheaper and more diverse experiments which implies we need better ecosystems for experimentation. This has led us to focus on the software frameworks we’re using to develop machine learning systems including data oriented architectures (Borchert (2020);Lawrence (2019);Vorhemus and Schikuta (2017);Joshi (2007)), data maturity assessments (Lawrence et al. (2020)) and data readiness levels (See this blog post on Data Readiness Levels. and Lawrence (2017);The DELVE Initiative (2020a))
One challenge for data science and data science processes is that they do not always accommodate the real-time and evolving nature of data science advice as required, for example in pandemic response or in managing an international supply chain.
Figure: Data science processes do not always accommodate the real-time and evolving nature of data science advice as required, for example, for policy advice as described in this presentation.
Ride Sharing: Service Oriented to Data Oriented
The modern approach to software systems design is known as a service-oriented architectures (SOA). The idea is that software engineers are responsible for the availability and reliability of the API that accesses the service they own. Quality of service is maintained by rigorous standards around testing of software systems.
In data driven decision-making systems, the quality of decision-making is determined by the quality of the data. We need to extend the notion of service-oriented architecture to data-oriented architecture (DOA).
The focus in SOA is eliminating hard failures. Hard failures can occur due to bugs or systems overload. This notion needs to be extended in ML systems to capture soft failures associated with declining data quality, incorrect modeling assumptions and inappropriate re-deployments of models. We need to focus on data quality assessments. In data-oriented architectures engineering teams are responsible for the quality of their output data streams in addition to the availability of the service they support (Lawrence, 2017). Quality here is not just accuracy, but fairness and explainability. This important cultural change would be capable of addressing both the challenge of technical debt (Sculley et al., 2015) and the social responsibility of ML systems.
Software development proceeds with a test-oriented culture. One where tests are written before software, and software is not incorporated in the wider system until all tests pass. We must apply the same standards of care to our ML systems, although for ML we need statistical tests for quality, fairness, and consistency within the environment. Fortunately, the main burden of this testing need not fall to the engineers themselves: through leveraging classical statistics and emulation we will automate the creation and redeployment of these tests across the software ecosystem, we call this ML hypervision.
Modern AI can be based on ML models with many millions of parameters, trained on very large data sets. In ML, strong emphasis is placed on predictive accuracy whereas sister-fields such as statistics have a strong emphasis on interpretability. ML models are said to be ‘black boxes’ which make decisions that are not explainable.1
For the ride sharing system, we start to see a common issue with a more complex algorithmic decision-making system. Several decisions are being made multiple times. Let’s look at the decisions we need along with some design criteria.
- Driver Availability: Estimate time to arrival for Anne’s ride using Anne’s location and local available car locations. Latency 50 milliseconds
- Cost Estimate: Estimate cost for journey using Anne’s destination, location and local available car current destinations and availability. Latency 50 milliseconds
- Driver Allocation: Allocate car to minimize transport cost to destination. Latency 2 seconds.
So we need:
- a hypothetical to estimate availability. It is constrained by lacking destination information and a low latency requirement.
- a hypothetical to estimate cost. It is constrained by low latency requirement and
Simultaneously, drivers in this data ecosystem have an app which notifies them about new jobs and recommends them where to go.
Further advantages. Strategies for data retention (when to snapshot) can be set globally.
A few decisions need to be made in this system. First of all, when the user opens the app, the estimate of the time to the nearest ride may need to be computed quickly, to avoid latency in the service.
This may require a quick estimate of the ride availability.
The Fynesse paradigm is inspired by experience in operational data science working with Data Science Africa, deploying in the Amazon supply chain and in the UK Covid-19 pandemic response.
Figure: The challenges of operational data science are closer to the challenges of deploying software and machine learning solutions than a classical analysis. The AutoAI project at Cambridge is focussed on maintaining and explaining AI solutions.
Arguably the challenges for automated data science and deploying complex machine learning solutions are similar. The AutoAI project at Cambridge is focussed on maintaining and explaining machine learning systems. The assumption is that such systems are generally made up of interacting components that make decisions in a composite manner. They have interfaces to the real world where that data is collected, but they also generate data within themselves. The challenge of collecting data is sometimes less the challenge of pacing the streets and more the challenge of extracting it from existing systems.
The Fynesse Framework
The Fynesse paradigm considers three aspects to data analysis: Access, Assess, Address. In this way it builds on many two stage processes that consider data collection and data wrangling to be two separate stages. There are two key differences to the Fynesse process. Firstly, the attempt to separate data wrangling tasks into (a) those that can be done without knowing the downstream task (Assess) and (b) those that can only be done with knowing the downstream task (Address). Naturally, this won’t turn out to be a clean separation. But the ethos is to ensure that any reusable tasks that is done in the process of data wrangling is labelled as such and pushed back into the data ecosystem. Secondly, our use of the term aspects instead of stages acknowledges the fact that although there is a natural ordering to the aspects, we find that in practice the data scientist is often moving quickly across the different aspects, so that the mind set of “stages” can be unhelpful.
Access
The first aspect we’ll consider is accessing the data. Depending on domain, the skills needed to address this challenge will vary greatly. For example, Michael T. Smith was leading a project in collaboration with the Kampala police force to collate accident data.
The access aspect is associated with data readiness level C (Lawrence (2017)).
Crash Map Kampala
The Crash Map Kampala project is a good example of a data science project where a major challenge was access.
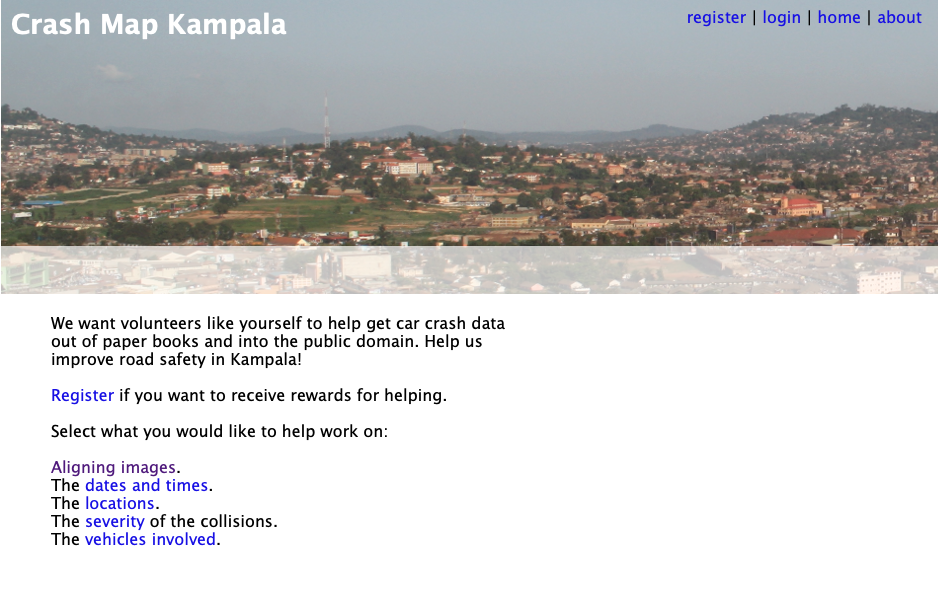
Figure: Crash Map Kampala was an initiative by Michael T. Smith and Bagonza Jimmy Owa Kinyonyi to map the location, date and severity of vehicle accidents across the city of Kampala. Original storage location for the data was in police logbooks.
The project is work from Bagonza Jimmy Owa Kinyony when he was an MSc student and Michael T. Smith when he was based at Makerere University AI-LAB.
The project was inspired by the observation that road traffic accidents are a leading cause of death for the young in many contexts, but the scale of the cause is difficult to compare directly because the number of deaths and serious injuries are difficult to access.
In Kampala this data is stored in logbooks at local police stations. Jimmy was in the Kampala police at the time, so the project focus was transcribing this information into a digital format where it could be mapped.
Due to the scale of the task, the approach of crowd sourcing the work was considered. This approach was also what launched the AI revolution through the ImageNet challenge, where data was labelled through Mechanical Turk (Russakovsky et al. (2015)).
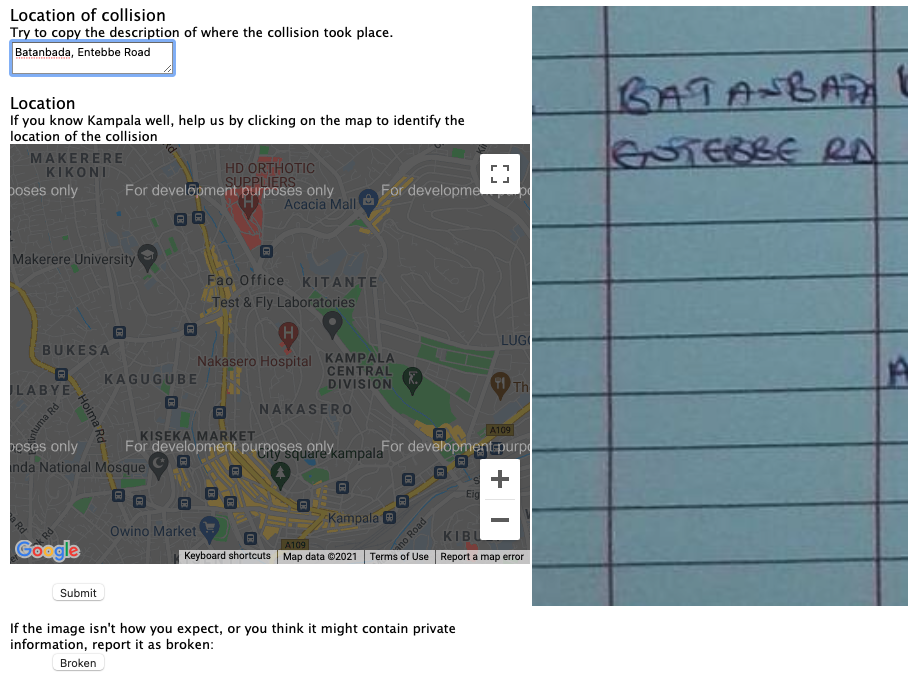
Figure:
But there are additional challenges with this data. The logbooks are typically accessed only by members of Kampala’s police force, in their recording of the accidents. So, permission from the police force was important. Additionally, personal information about those involved in the accidents might have been revealed in the process of crowdsourcing the work.
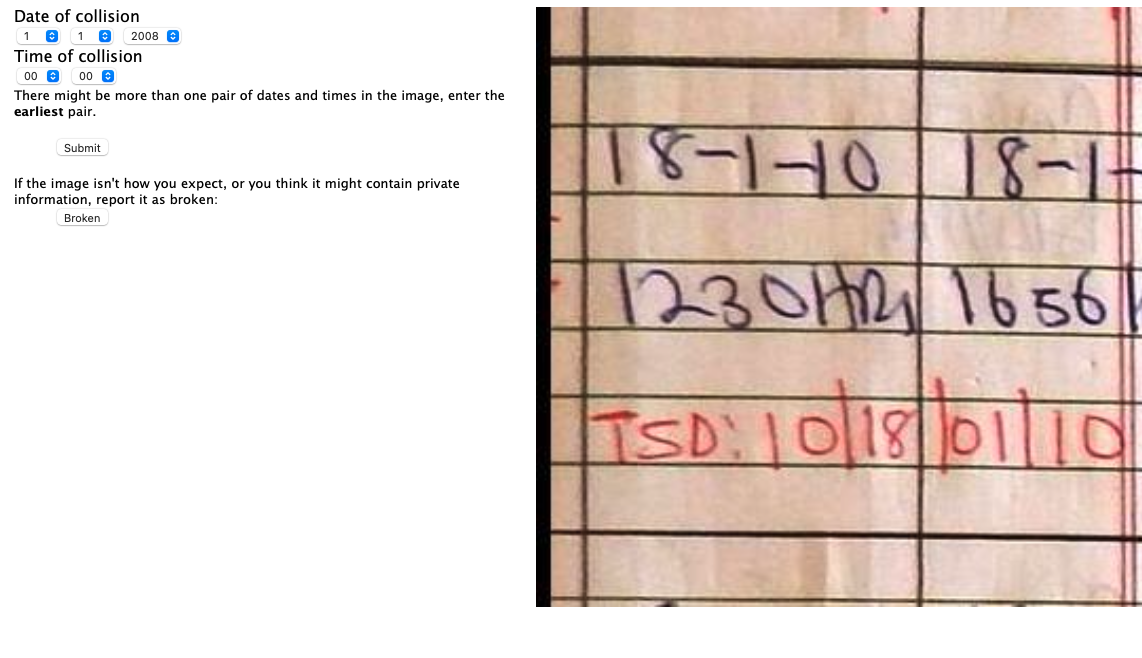
Figure: Alongside the location, the date and time of the crash gives more information that can be used to map crashes over time.
Much of the work here was therefore in the access of the data. Photographing the logbooks, obtaining legal permission from the Kampala police, ensuring that personal information was unlikely to be divulged.
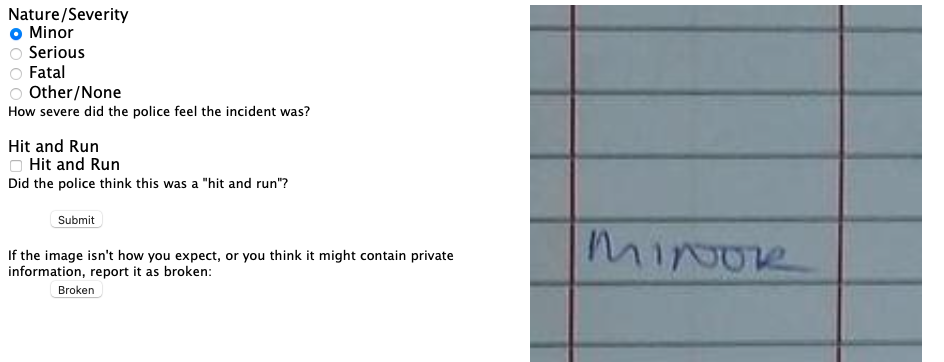
Figure: The severity of the crash is helpful in understanding how people are being affected by road accidents.
As well as software design and build, the work has legal and ethical issues. An important aspect in gaining progress was that Jimmy worked for the Kampala police. Indeed, the work eventually stalled when Jimmy was moved to a different police location.
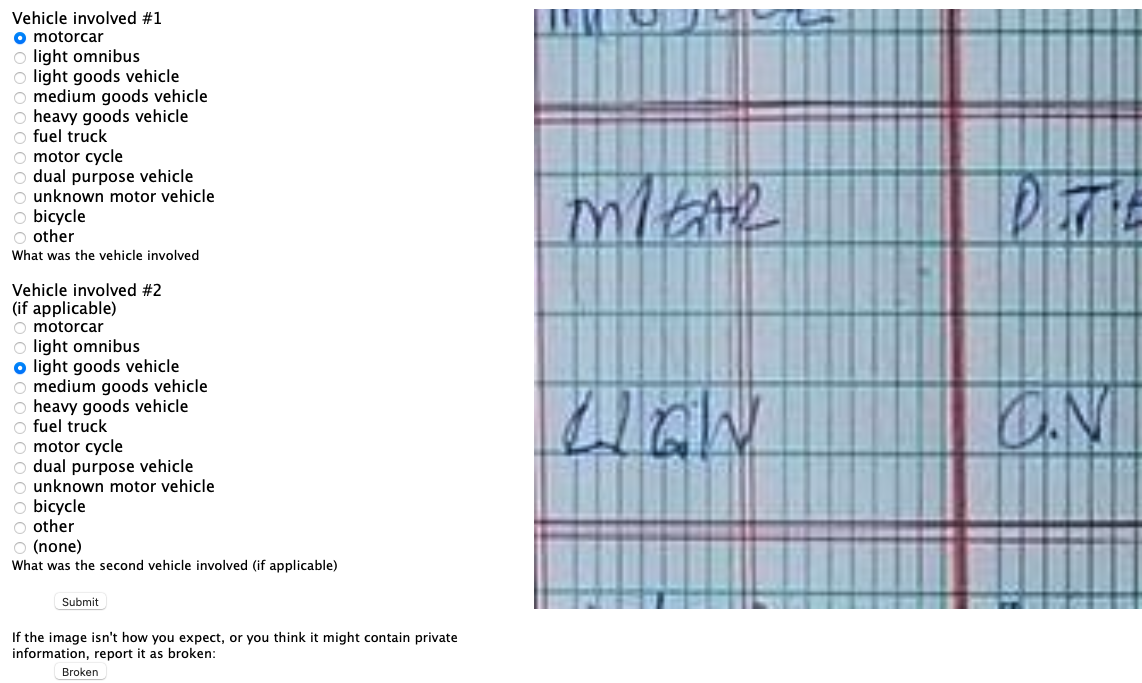
Figure: Understanding which vehicles are involved in accidents could also help with interventions that may be necessary.
The possibility of leaking personal information was reduced, by presenting only a portion of each logbook page to users for analysis. So we can see in Figure \(\ref{crash-map-kampala-location}\) the interface for obtaining the location from the logbook. But the date and time (Figure \(\ref{crash-map-kampala-date-time}\)) the severity of the accident (Figure \(\ref{crash-map-kampala-severity}\)) and the vehicles involved (Figure \(\ref{crash-map-kampala-vehicles}\)) are all dealt with in separate parts of the interface.
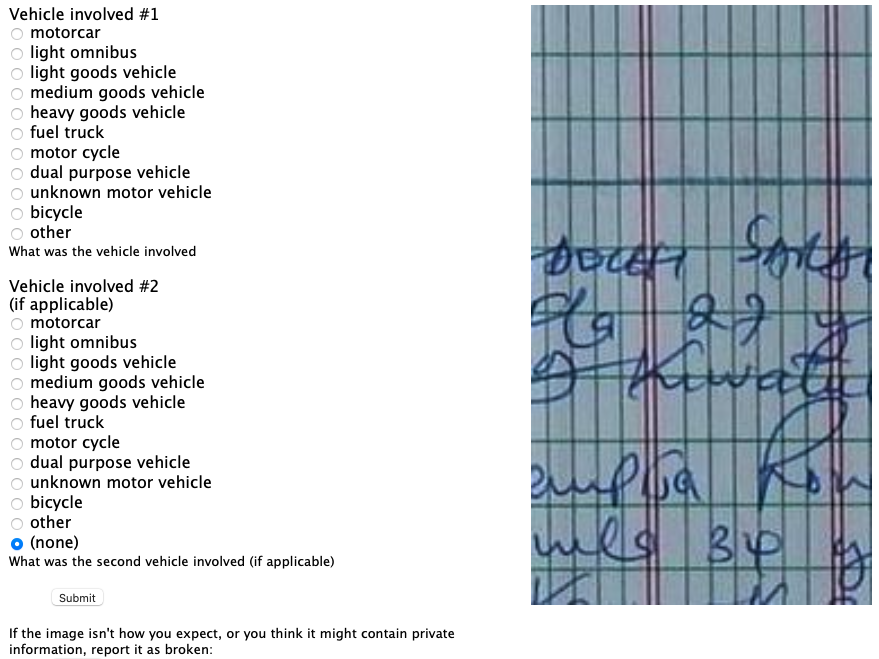
Figure:
It seems a great challenge to automate all the different aspects of the process of data access, but this challenge is underway already through the process of what is commonly called digital transformation. The process of digital transformation takes data away from physical logbooks and into digital devices. But that transformation process itself comes with challenges. For example, the Kampala police force is not currently equipped to store this data in purely digital form. It would require not only devices (which many officers will have access to) but a system of backup and storage that is beyond the capabilities of many organisations.
Legal complications around data are still a major barrier though. In the EU and the US database schema and indices are subject to copyright law. Companies making data available often require license fees. As many data sources are combined, the composite effect of the different license agreements often makes the legal challenges insurmountable. This was a common challenge in the pandemic, where academics who could deal with complex data predictions were excluded from data access due to challenges around licensing. A nice counter example was the work led by Nuria Oliver in Spain who after a call to arms in a national newspaper (Oliver (2020)) was able to bring the ecosystem together around mobility data.
However, even when organisation is fully digital, and license issues are overcome, there are issues around how the data is managed stored, accessed. The discoverability of the data and the recording of its provenance are too often neglected in the process of digital transformation. Further, once an organisation has gone through digital transformation, they begin making predictions around the data. These predictions are data themselves, and their presence in the data ecosystem needs recording. Automating this portion requires structured thinking around our data ecosystems.
Assess
Data that is accessible can be imported (via APIs or database calls or reading a CSV) into the machine and work can be done understanding the nature of the data. The important thing to say about the assess aspect is that it only includes things you can do without the question in mind. This runs counter to many ideas about how we do data analytics. The history of statistics was that we think of the question before we collect data. But that was because data was expensive, and it needed to be explicitly collected. The same mantra is true today of surveillance data. But the new challenge is around happenstance data, data that is cheaply available but may be of poor quality. The nature of the data needs to be understood before its integrated into analysis. Unfortunately, because the work is conflated with other aspects, decisions are sometimes made during assessment (for example approaches to imputing missing values) which may be useful in one context, but are useless in others. So the aim in assess is to only do work that is repeatable, and make that work available to others who may also want to use the data.
The assess aspect renders the Fynesse framework quite different form other data science frameworks that split the process into data wrangling and data modelling. It acknowledges that there is a component to both wrangling and modelling that is specific to the task (this occurs in the address aspect) and a component that is useful across tasks (the assess aspect). This is important in the wider system because any reusable work can be shared. By keeping this uppermost in the mind through the assess aspect, then the wider data ecosystem benefits.
The assess aspect is associated with data readiness level B (Lawrence (2017)).
Case Study: Text Mining for Misinformation
We consider a case study from Joyce Nabende, Head of the Makerere AI Lab. This case study is based on a presentation given by Joyce to the DSA Research Grants, “Project Progress” session on 20th August 2021.
The aim of the case study is to map some of the approaches used by Joyce onto the Access, Assess, Address paradigm.
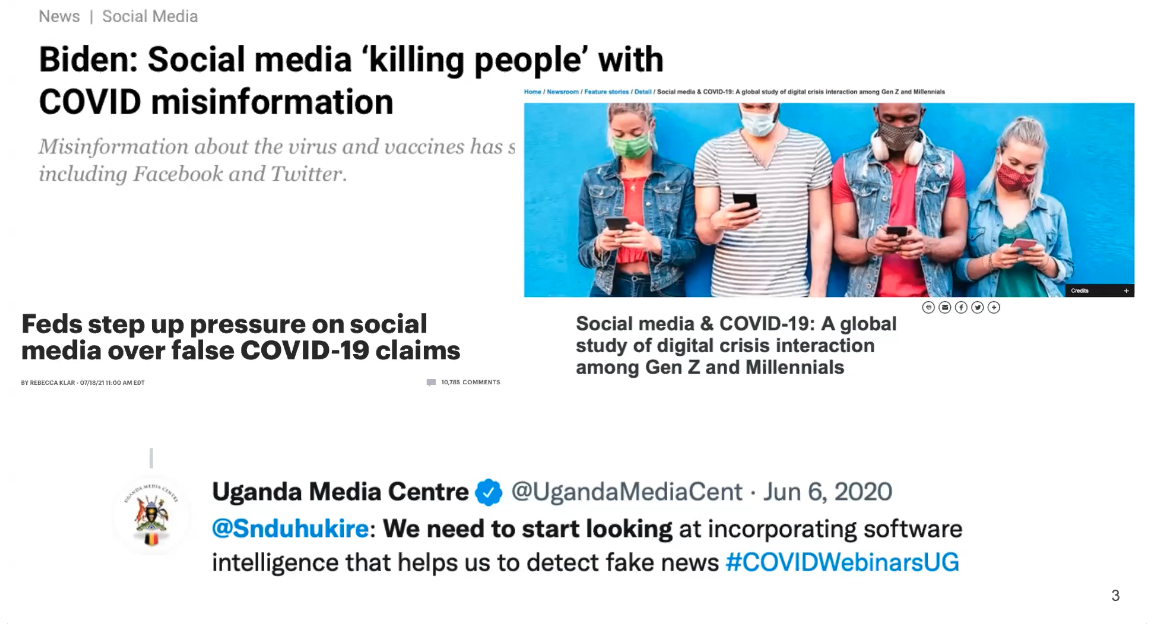
The aim of the project is to develop tools for automated misinformation detection. Web, mobile based social media platforms. Social media posts are invalid, inaccurate, potentially harmful. This is set within the context of the Covid-19 pandemic within Uganda.
In common with many applications of data science, and in line with traditional statistics, the question here comes first, at the beginning of the data collection. But the access of the data is made easier by the fact that the data exists in the digital space already. There are APIs for collecting data from Facebook and Twitter.
The focus here will be trying to understand which parts of this data collection process might be reusable for others. The aim is to separate those reusable parts from aspects that are specific to the question.
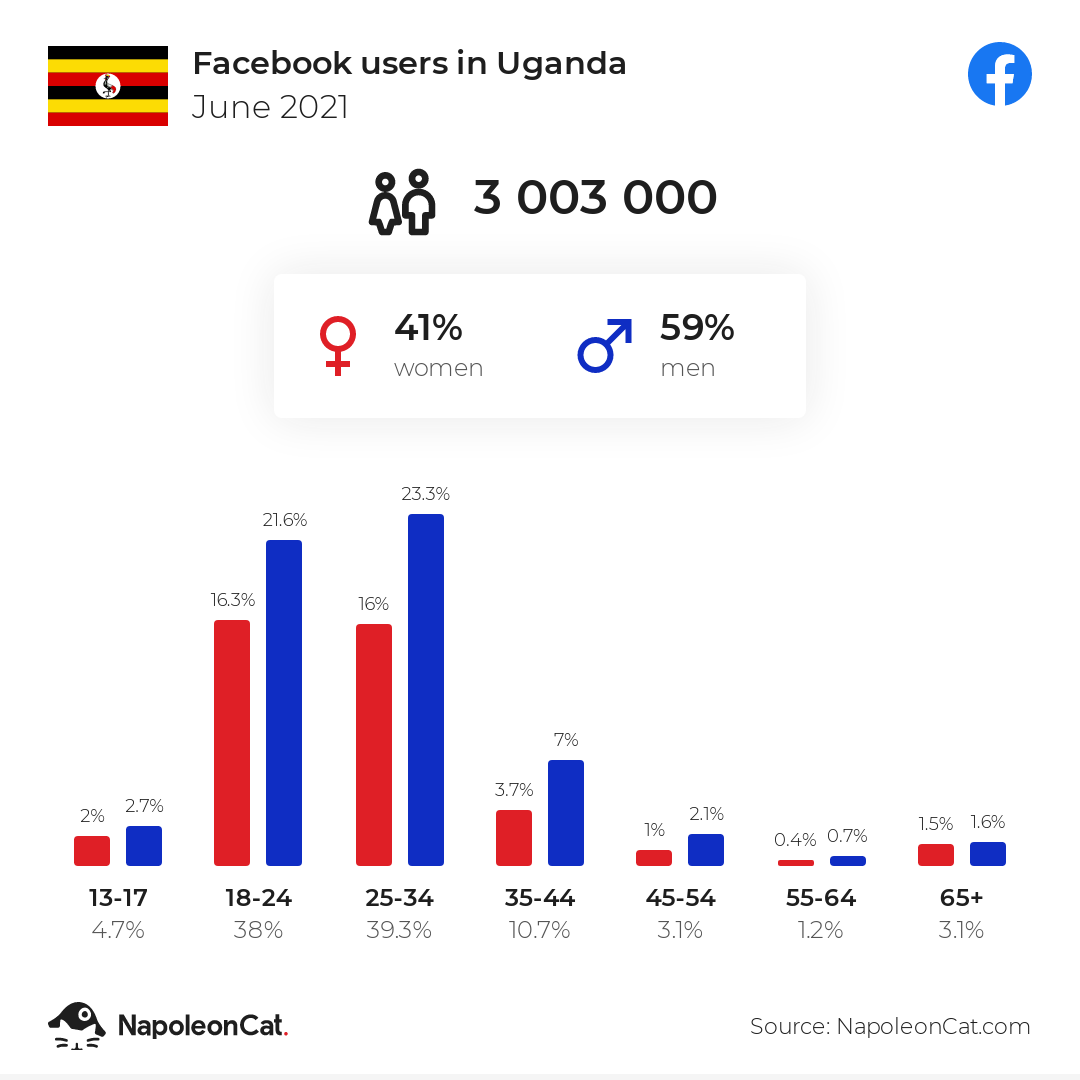
As with any data science problem, it’s vital that domain knowledge is included in the analysis of the problem. To set context, we see in Figure \(\ref{napoleoncat-social-media-statistics-facebook-users-in-uganda_2021_06}\) how widespread use of social media is in Uganda for different age groups. The total population of Uganda is around 47 million.
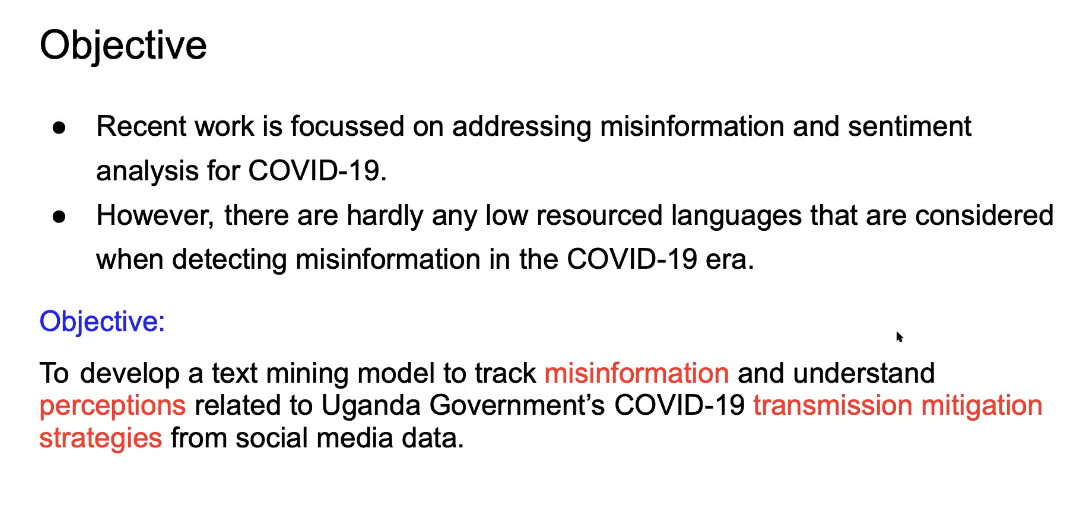
Figure: The objective of the project is to track misinformation and understandperceptions of Ugandan Government’s COVID-19 transmission mitigation strategies.
One challenge for this project is dealing with a data set with multiple languages. In Uganda, people don’t just communicate in English, but they will code-switch or communicate purely in, e.g. Luganda. Tools and resources for dealing with code-switching or the Lugandan language in NLP are much less common than tools for dealing with high resource languages (e.g. German, English, French, Spanish, Mandarin). See Magueresse et al. (2020) for a review of NLP in low resource languages, multilingual data sets bring their own problems Aman Ullah et al. (2020).
The Luganda language is the most widely spoken indigenous language in Uganda with more than seven million speakers. By definition, a low resourced language has less capabilities for data annotation and augmentation, e.g. part of speech taggers.
Data Access
The social media data was collected from a set of pages (media institutions, ministry of health, media personalities, top twitter/facebook users from Uganda. All data was then filtered using keywords, ‘ssenyiga’, ‘kolona’, ‘corona’ ,‘virus’ ,‘obulwadde’, ‘corona’, ‘covid’, ‘abalwadde’, ‘ekirwadde’, ‘akawuka’, ‘staysafeug’, ‘stayhome’, ‘tonsemberera’, ‘tokwatakudereva’, ‘vaccine’ to select with Covid-19 related tweets. Very short Facebook posts were also removed. Data was collected in two phases, from March 2020 - March 2021 and then from June 2021 - August 2021. Raw data points 15,354 posts from twitter and 430,075 from Facebook.
Note that in this case, knowledge of the question has been used in accessing the data. The context of the data is Uganda and the focus is Covid-19. That focus is driven by the pandemic. However, as we see when we get to data assessment, there is still an amount of reusable work that could/should be automated.
Data Assessment
After collecting data, the initial assessment was formed to understand the data, uncover patterns and gain insights. Here various visualisations can be used to find any unexpected factors in the data.
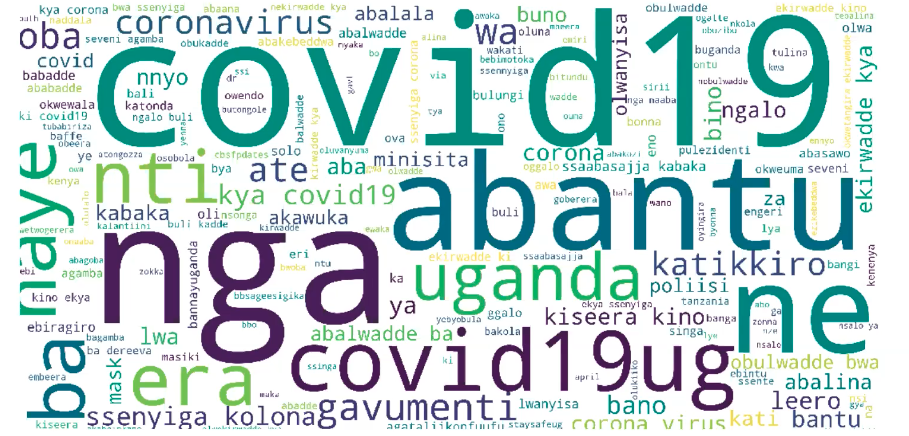
Figure: Word cloud from the Twitter data collected through the filtering.
In the case of the Uganda data set, Joyce found that mixed in with the Covid-19 data were topics focussed on popular Ugandan TV shows and the Ugandan election.

Figure: Word cloud from the Facebook data collected through the filtering.
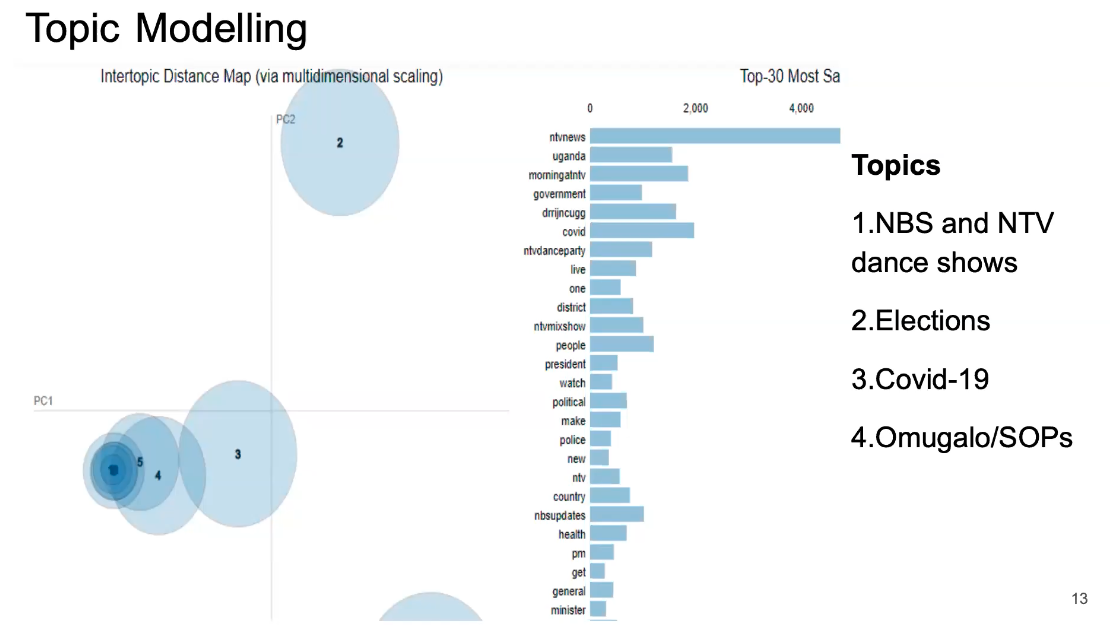
Figure: LDA topics and topic distance maps. Interspersed with the Covid-19 topics are topics associated with television dance shows, elections, and the president showing the importance of having domain knowledge.
Topic modeling highlights the different subjects present in the data, and how they interrelate.
- Annotation attributes:
- Data source [Facebook, Twitter]
- Language [English, Luganda, and codemixed]
- Aspect [truck drivers, hospitals, vaccine, cases, SOPs, NPIs, Testing, Border, Covid19_Impact, Presidential address, death, elections and Covid19]
- Sentiment [positive, negative and neutral]
- Misinformation [Not Fake, Fake, Partially Fake, and Others]
- As part of quality assurance, the data was reviewed by an independent team to ensure that the annotation guidelines were followed.}
Annotation carried out by seven annotators who could understand both English and Luganda. The data was labeled with the Doccano text annotation tool. Annotations included the data source, the language, the label, the sentiment, and the misinformation status.
Quality assurance performed by reviewing data with an independent team for ensuring annotation guidelines were followed.
Table: Portion of data that was annotated.
Initial dataset | 15,354 | 430,075 |
Dataset after Annotation | 3,527 | 4,479 |
Cohen’s kappa inter-annotation used to measure annotator agreement.
Table: Cohen’s kappa agreement scores for the data.
Aspect | 0.69 |
Sentiment | 0.73 |
Misinformation | 0.74 |

Figure: Example of data annotation for sentiment and misinformation from the data set.
The idea of the analysis is to bring this information together for sentiment and misinformation analysis in a dashboard for Covid-19 in Uganda.
Automating Assess
There are lots of interesting projects around automating the assessment of the data, for example one can consider automation of schema and data type detection (Valera and Ghahramani (2017)) or the AI for Data Analytics Project (see Nazábal et al. (2020) for an overview of issues and case studies and the video in Figure \(\ref{ai-for-data-analytics}\) for details on the project). We may even view projects like the automatic statistician as automating of assessment (James Robert Lloyd and Ghahramani. (2014)), although arguably one could suggest that the choice of data set used in those projects itself is reflective of the question or context. This highlights the difficulty in separating the aspects. The key quesiton to ask in any given context is whether the augmentation you are performing for the data set is going to be helpful or a hindrance to those that may wish to reuse your data.
Figure: The AI for Data Analytics project is an attempt to automate some of the challenges of automated data assessment.
Address
The final aspect of the process is to address the question. We’ll spend the least time on this aspect here, because it’s the one that is most widely formally taught and the one that most researchers are familiar with. In statistics, this might involve some confirmatory data analysis. In machine learning it may involve designing a predictive model. In many domains it will involve figuring out how best to visualise the data to present it to those who need to make the decisions. That could involve a dashboard, a plot or even summarisation in an Excel spreadsheet.
The address aspect is associated with data readiness level A (Lawrence (2017)).
Automating Address
Perhaps the most widespread approach to automating the address aspect is known as AutoML (see video in Figure \(\ref{frank-hutter-automl}\)). This is an automatic approach to creating ML prediction models. The automatic statistician we mentioned in assess also has some of these goals in mind for automating confirmatory data analysis. But there are clearly other aspects we may wish to automate, particularly around visualization.
Figure: Here Frank Hutter gives a tutorial on AutoML, one of the approaches to automating address.
Fynesse Template
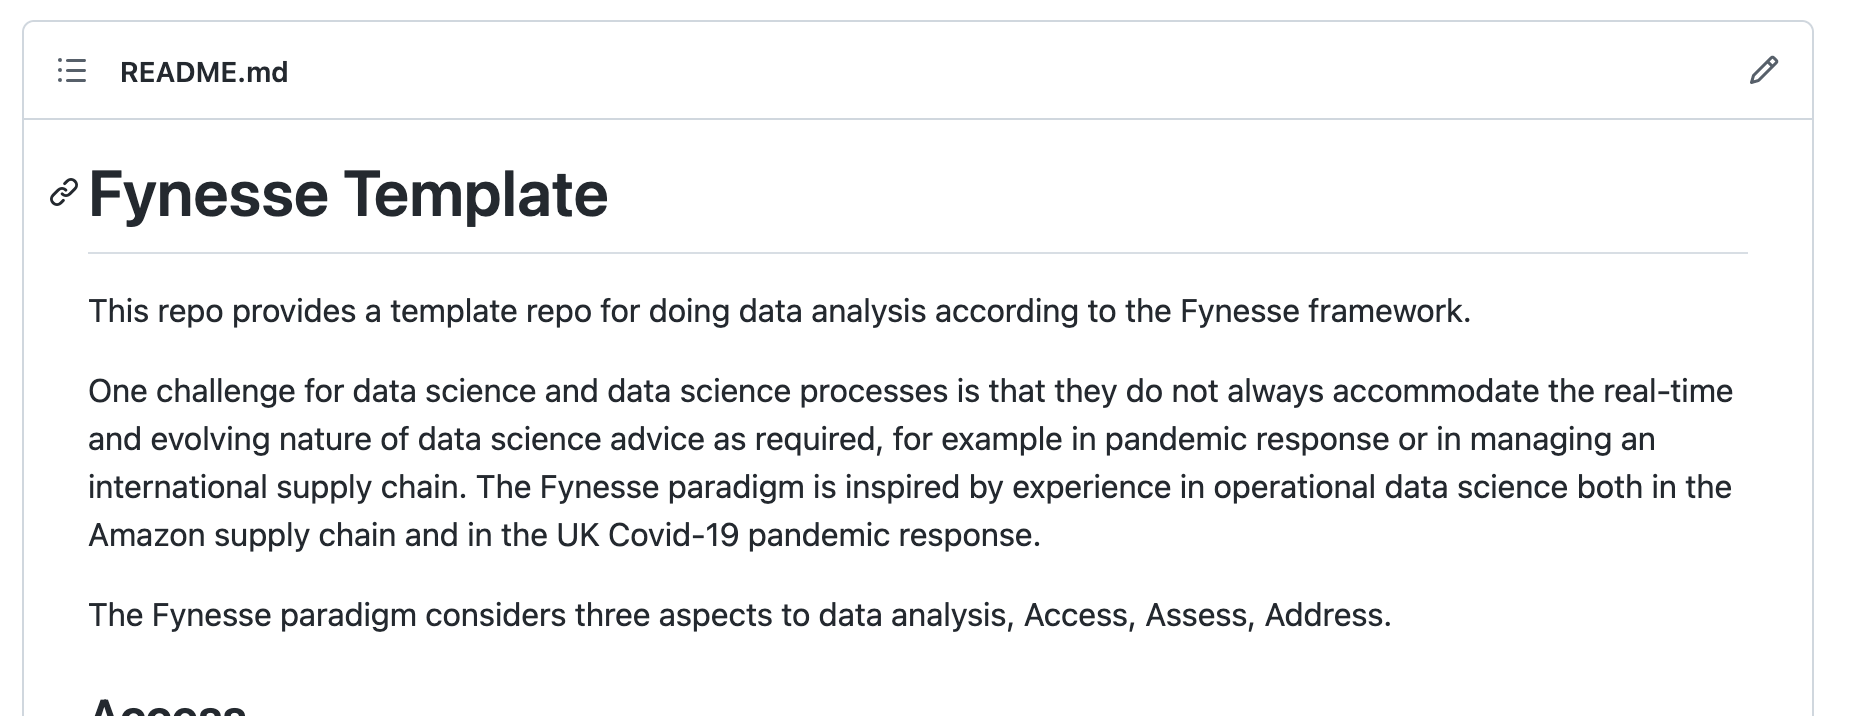
Figure: The Fynesse Template gives you a starting point for building your data science library. You can fork the template, and then create a new repository from the template. You can use that repository for your analysis.
To help you think about the aspects of the Fynesse data science framework, we’ve created a small GitHub template that’s available here. We suggest the following approach to using the template. Firstly: fork the template to your own GitHub account. Then you can base your analysis software on the template. If there are aspects to the template that you think need updating (including things you don’t like!), then you can update those and submit a pull request so that others can benefit.
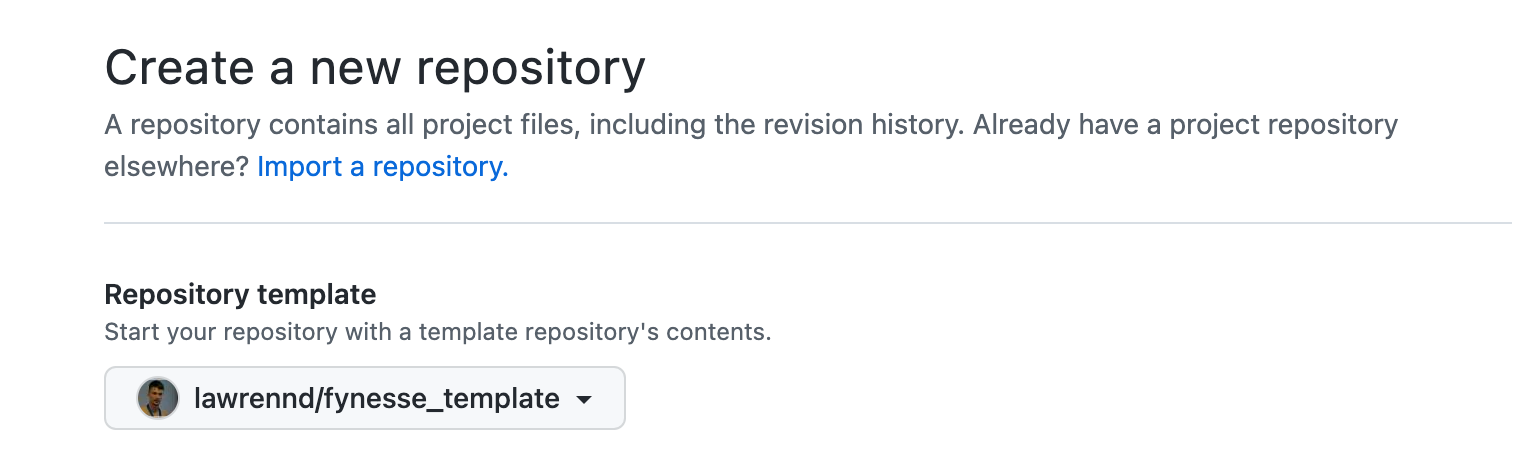
Figure: Setting up a new repository in github from a template. By basing your repository on the fynesse template, you will have a starting point for your analysis framework.
GitHub makes it easy to create a new repository from this framework. Although you should feel free to use your own tools for source code control if you find them more convenient.
For your assignment in this unit, we’d like you to base your submission around the Fynesse framework2. You can do this by forking the Fynesse template, or simply creating a python library which reflects that organisational structure.
Conclusions
The particular circumstances of the Covid-19 pandemic have highlighted the challenges of integrating scientific ideas to answer policy questions. In this talk, we’ve given a formal introduction to the problem, the difficulty of communicating between individuals (particularly from different domains) and reviewed the ideas and solutions we used in the Delve initiative.
Recommendations from the DELVE Data report suggest that more effort needs to be placed into working in this manner in normal circumstances, so that when an emergency occurs, we are better prepared to deal with the questions we face.
Thanks!
For more information on these subjects and more you might want to check the following resources.
- twitter: @lawrennd
- podcast: The Talking Machines
- newspaper: Guardian Profile Page
- blog: http://inverseprobability.com
References
Machine Learning Systems Design
The challenges of integrating different machine learning components into a whole that acts effectively as a system seem unresolved. In software engineering, separating parts of a system in this way is known as component-based software engineering. The core idea is that the different parts of the system can be independently designed according to a sub-specification. This is sometimes known as separation of concerns. However, once the components are machine learning based, tighter coupling becomes a side effect of the learned nature of the system. For example, if a driverless car’s detection of cyclist is dependent on its detection of the road surface, a change in the road surface detection algorithm will have downstream effects on the cyclist detection. Even if the road detection system has been improved by objective measures, the cyclist detection system may have become sensitive to the foibles of the previous version of road detection and will need to be retrained.
Most of our experience with deployment relies on some approximation to the component-based model, this is also important for verification of the system. If the components of the system can be verified then the composed system can also, potentially, be verified.
Pigeonholing

Figure: Decompartmentalization of the model into parts can be seen as pigeonholing the separate tasks that are required.
To deal with the complexity of systems design, a common approach is to break complex systems down into a series of tasks. An approach we can think of as “pigeonholing”. Classically, a sub-task could be thought of as a particular stage in machining (by analogy to division of labour and production lines in factories) or a sub-routine call in computing. Machine learning allows any complex sub-task, that was difficult to decompose by classical methods, to be reconstituted by acquiring data. In particular, when we think of emulating a human, we can ask many humans to perform the sub-task many times and fit machine learning models to reconstruct the performance, or to emulate the human in the performance of the task. For example, the decomposition of a complex process such as driving a car into apparently obvious sub-tasks (following the road, identifying pedestrians, etc).
The practitioner’s approach to deploying artificial intelligence systems is to build up systems of machine learning components. To build a machine learning system, we decompose the task into parts, each of which we can emulate with ML methods. These parts are typically independently constructed and verified. For example, in a driverless car we can decompose the tasks into components such as “pedestrian detection” and “road line detection”. Each of these components can be constructed with, for example, a classification algorithm. Nowadays, people will often deploy a deep neural network, but for many tasks a random forest algorithm may be sufficient. We can then superimpose a logic on top. For example, “Follow the road line unless you detect a pedestrian in the road”.
This allows for verification of car performance, as long as we can verify the individual components. However, it also implies that the AI systems we deploy are fragile.
Our intelligent systems are composed by “pigeonholing” each individual task, then substituting with a machine learning model.
But this is not a robust approach to systems design. The definition of sub-tasks can lead to a single point of failure, where if any sub-task fails, the entire system fails.
Rapid Reimplementation
This is also the classical approach to automation, but in traditional automation we also ensure the environment in which the system operates becomes controlled. For example, trains run on railway lines, fast cars run on motorways, goods are manufactured in a controlled factory environment.
The difference with modern automated decision-making systems is our intention is to deploy them in the uncontrolled environment that makes up our own world.
This exposes us to either unforeseen circumstances or adversarial action. And yet it is unclear our intelligent systems are capable of adapting to this.
We become exposed to mischief and adversaries. Adversaries intentionally may wish to take over the artificial intelligence system, and mischief is the constant practice of many in our society. Simply watching a 10-year-old interact with a voice agent such as Alexa or Siri shows that they are delighted when the can make the the “intelligent” agent seem foolish.
The Centrifugal Governor

Figure: Centrifugal governor as held by “Science” on Holborn Viaduct
Boulton and Watt’s Steam Engine
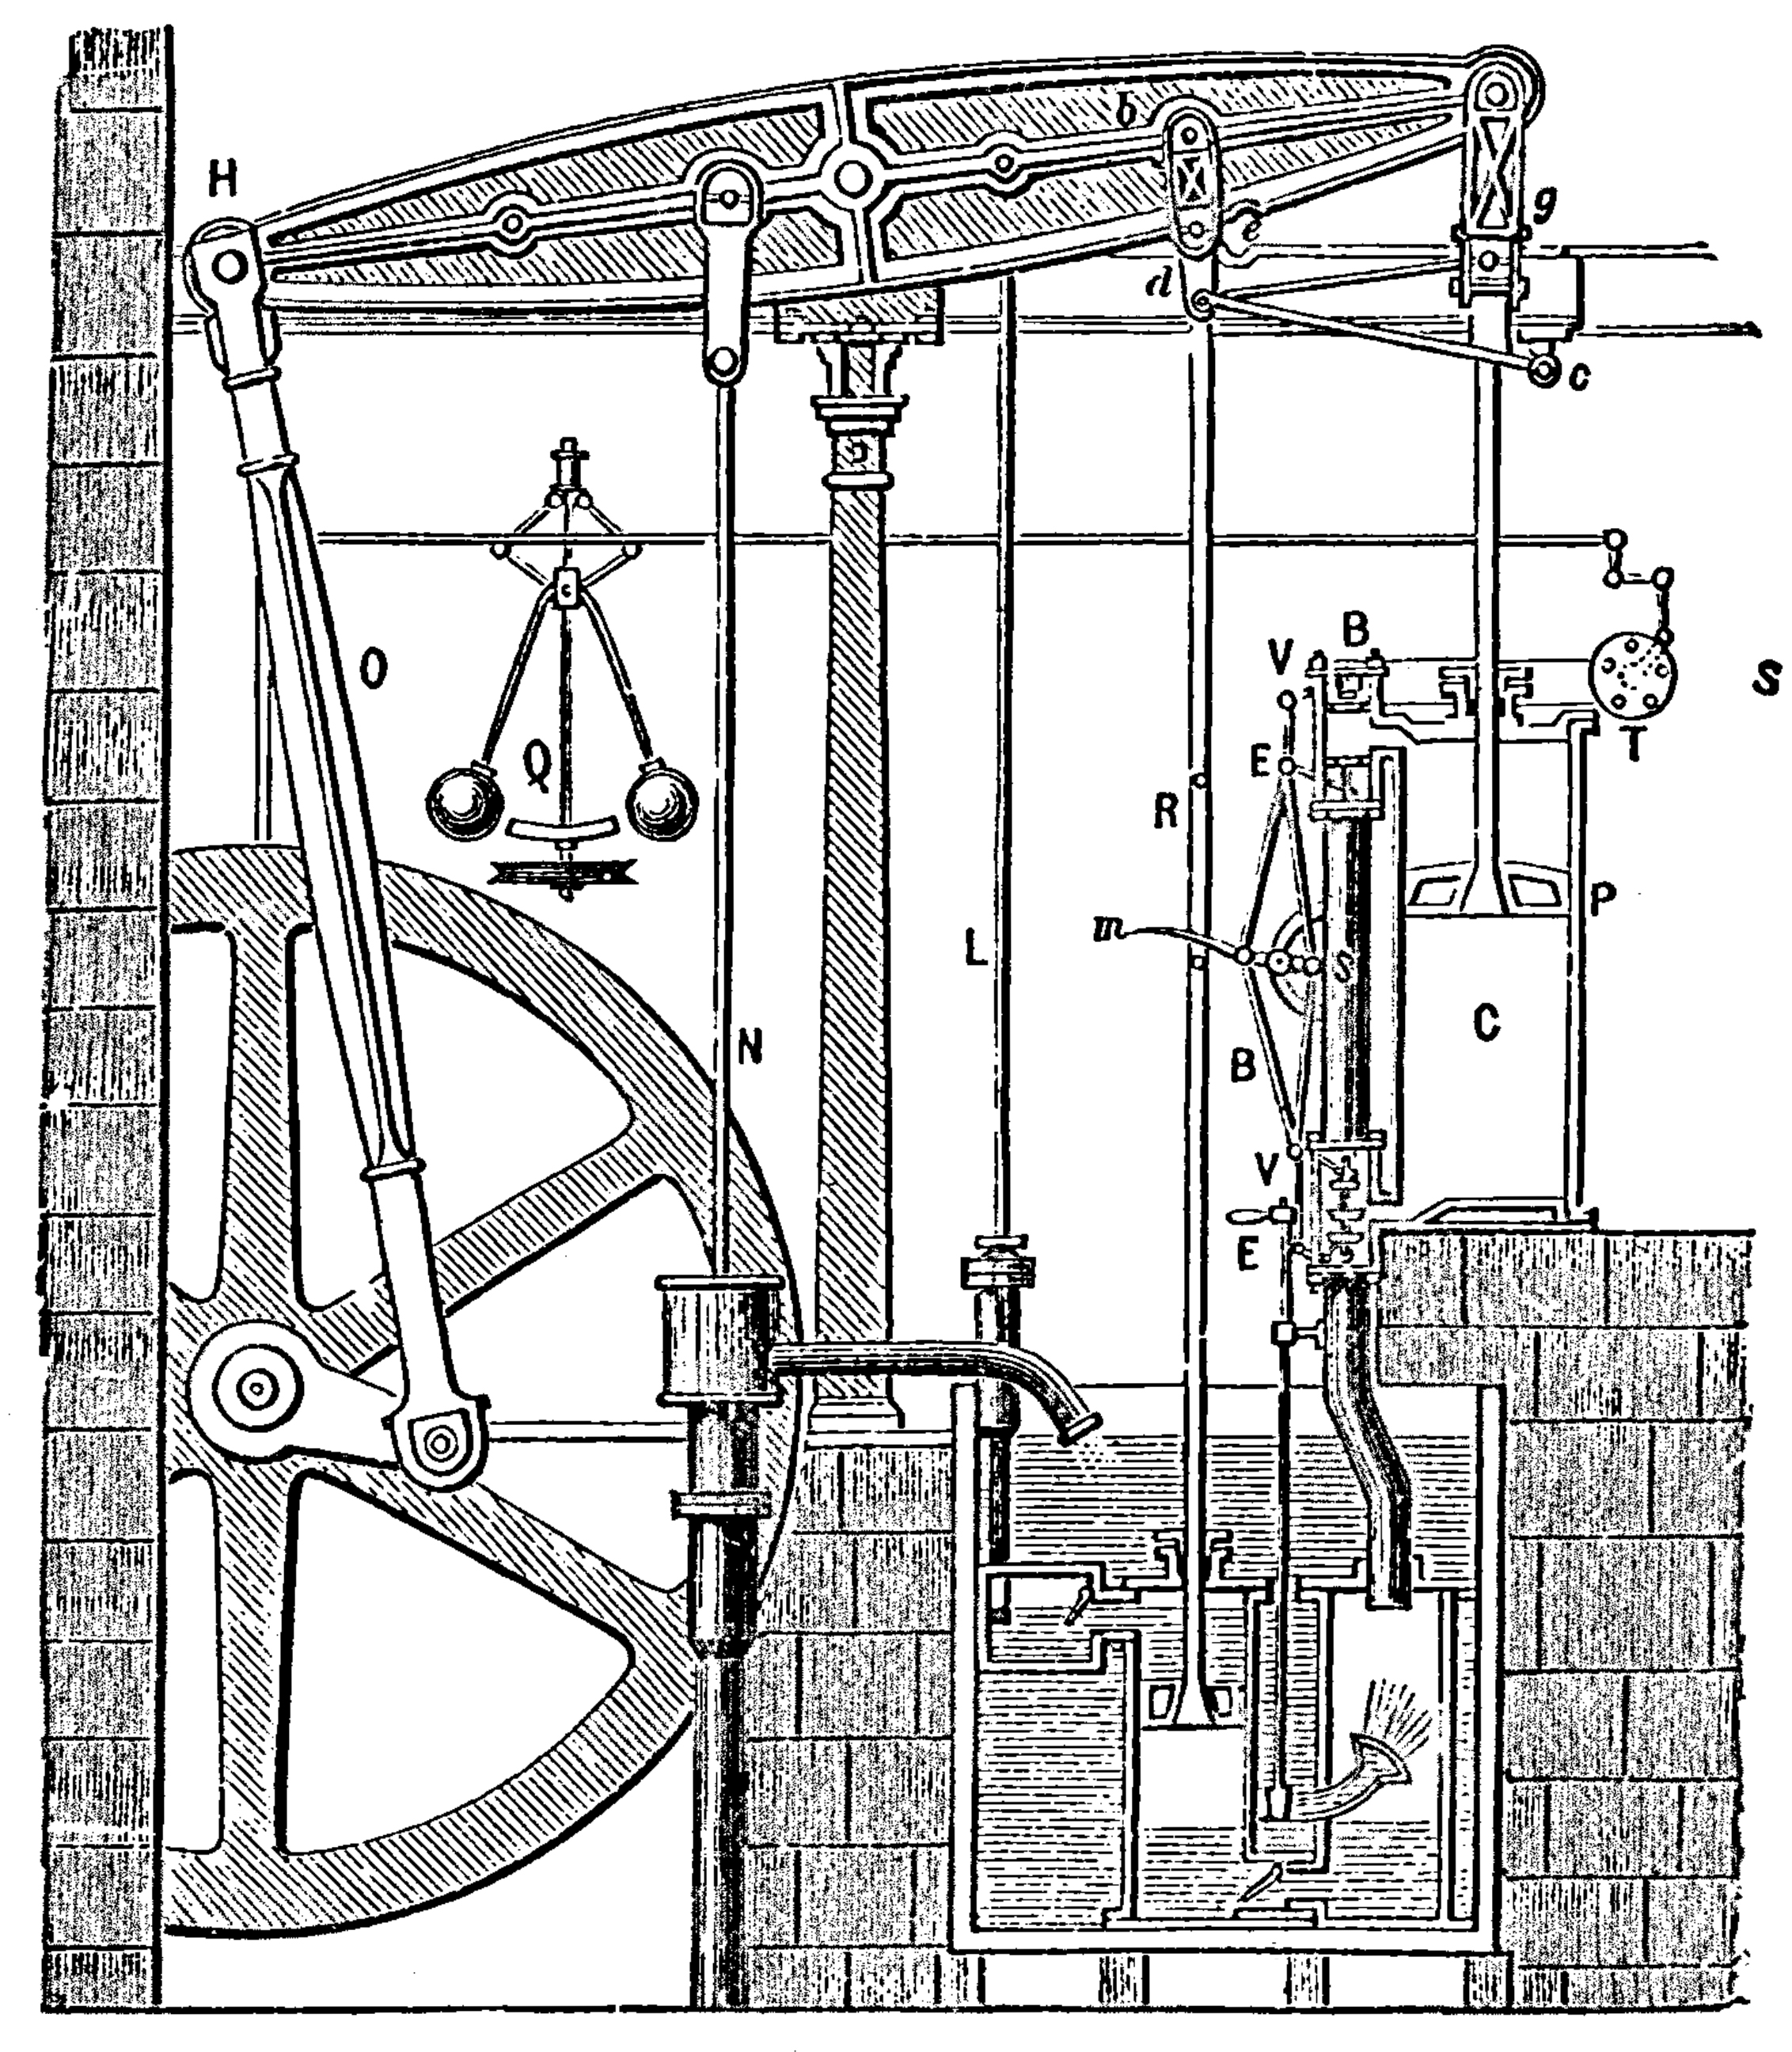
Figure: Watt’s Steam Engine which made Steam Power Efficient and Practical.
James Watt’s steam engine contained an early machine learning device. In the same way that modern systems are component based, his engine was composed of components. One of which is a speed regulator sometimes known as Watt’s governor. The two balls in the center of the image, when spun fast, rise, and through a linkage mechanism.
The centrifugal governor was made famous by Boulton and Watt when it was deployed in the steam engine. Studying stability in the governor is the main subject of James Clerk Maxwell’s paper on the theoretical analysis of governors (Maxwell, 1867). This paper is a founding paper of control theory. In an acknowledgment of its influence, Wiener used the name cybernetics to describe the field of control and communication in animals and the machine (Wiener, 1948). Cybernetics is the Greek word for governor, which comes from the latin for helmsman.
A governor is one of the simplest artificial intelligence systems. It senses the speed of an engine and acts to change the position of the valve on the engine to slow it down.
Although it’s a mechanical system a governor can be seen as automating a role that a human would have traditionally played. It is an early example of artificial intelligence.
The centrifugal governor has several parameters, the weight of the balls used, the length of the linkages and the limits on the balls’ movement.
Two principal differences exist between the centrifugal governor and artificial intelligence systems of today.
- The centrifugal governor is a physical system, and it is an integral part of a wider physical system that it regulates (the engine).
- The parameters of the governor were set by hand, our modern artificial intelligence systems have their parameters set by data.
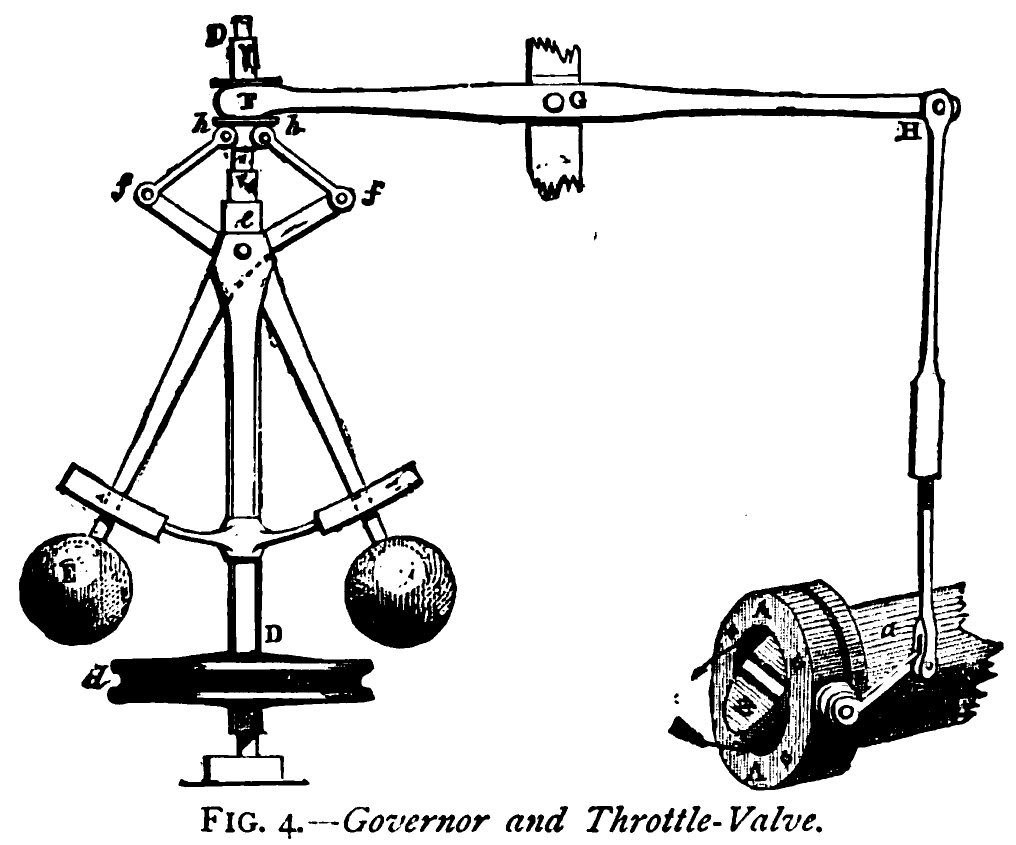
Figure: The centrifugal governor, an early example of a decision-making system. The parameters of the governor include the lengths of the linkages (which effect how far the throttle opens in response to movement in the balls), the weight of the balls (which effects inertia) and the limits of to which the balls can rise.
This has the basic components of sense and act that we expect in an intelligent system, and this system saved the need for a human operator to manually adjust the system in the case of overspeed. Overspeed has the potential to destroy an engine, so the governor operates as a safety device.
The first wave of automation did bring about sabotage as a worker’s response. But if machinery was sabotaged, for example, if the linkage between sensor (the spinning balls) and action (the valve closure) was broken, this would be obvious to the engine operator at start up time. The machine could be repaired before operation.
The centrifugal governor was a key component in the Boulton-Watt steam engine. It senses increases in speed in the engine and closed the steam valve to prevent the engine overspeeding and destroying itself. Until the invention of this device, it was a human job to do this.
The formal study of governors and other feedback control devices was then began by James Clerk Maxwell, the Scottish physicist. This field became the foundation of our modern techniques of artificial intelligence through Norbert Wiener’s book Cybernetics (Wiener, 1948). Cybernetics is Greek for governor, a word that in itself simply means helmsman in English.
The recent WannaCry virus that had a wide impact on our health services ecosystem was exploiting a security flaw in Windows systems that was first exploited by a virus called Stuxnet.
Stuxnet was a virus designed to infect the Iranian nuclear program’s Uranium enrichment centrifuges. A centrifuge is prevented from overspeed by a controller, just like the centrifugal governor. Only now it is implemented in control logic, in this case on a Siemens PLC controller.
Stuxnet infected these controllers and took over the response signal in the centrifuge, fooling the system into thinking that no overspeed was occurring. As a result, the centrifuges destroyed themselves through spinning too fast.
This is equivalent to detaching the governor from the steam engine. Such sabotage would be easily recognized by a steam engine operator. The challenge for the operators of the Iranian Uranium centrifuges was that the sabotage was occurring inside the electronics.
That is the effect of an adversary on an intelligent system, but even without advesaries, the mischief of a 10-year-old can confuse our AIs.
Peppercorns
Figure: A peppercorn is a system design failure which is not a bug, but a conformance to design specification that causes problems when the system is deployed in the real world with mischievous and adversarial actors.
Asking Siri “What is a trillion to the power of a thousand minus one?” leads to a 30 minute response3 consisting of only 9s. I found this out because my nine year old grabbed my phone and did it. The only way to stop Siri was to force closure. This is an interesting example of a system feature that’s not a bug, in fact it requires clever processing from Wolfram Alpha. But it’s an unexpected result from the system performing correctly.
This challenge of facing a circumstance that was unenvisaged in design but has consequences in deployment becomes far larger when the environment is uncontrolled. Or in the extreme case, where actions of the intelligent system effect the wider environment and change it.
These unforeseen circumstances are likely to lead to need for much more efficient turn-around and update for our intelligent systems. Whether we are correcting for security flaws (which are bugs) or unenvisaged circumstantial challenges: an issue I’m referring to as peppercorns. Rapid deployment of system updates is required. For example, Apple have “fixed” the problem of Siri returning long numbers.
Here’s another one from Reddit, of a Tesla Model 3 system hallucinating traffic lights.
The challenge is particularly acute because of the scale at which we can deploy AI solutions. This means when something does go wrong, it may be going wrong in billions of households simultaneously.
You can also check this blog post on Decision Making and Diversity. and this blog post on Natural vs Artifical Intelligence..
The Three Ds of Machine Learning Systems Design
We can characterize the challenges for integrating machine learning within our systems as the three Ds. Decomposition, Data and Deployment.
The first two components decomposition and data are interlinked, but we will first outline the decomposition challenge. Below we will mainly focus on supervised learning because this is arguably the technology that is best understood within machine learning.
Data Science and Professionalisation
The rise in data science and artificial intelligence technologies has been termed “Industrial Revolution 4.0”, so are we in the midst of an industrial change? Maybe, but if so, it is the first part of the industrial revolution to be named before it has happened. The original industrial revolution occurred between 1760 and 1840, but the term was introduced into English by Arnold Toynbee (1852-1883).
Whether this is a new revolution or an extension of previous revolutions, an important aspect is that this revolution is dominated by data instead of just capital.
One can also see the modern revolution as a revolution in information rather than energy.
Disruptive technologies take time to assimilate, and best practices, as well as the pitfalls of new technologies take time to share. Historically, new technologies led to new professions. Isambard Kingdom Brunel (born 1806) was a leading innovator in civil, mechanical and naval engineering. Each of these has its own professional institutions founded in 1818, 1847, and 1860 respectively.
Nikola Tesla developed the modern approach to electrical distribution, he was born in 1856 and the American Institute for Electrical Engineers was founded in 1884, the UK equivalent was founded in 1871.
William Schockley Jr, born 1910, led the group that developed the transistor, referred to as “the man who brought silicon to Silicon Valley”, in 1963 the American Institute for Electrical Engineers merged with the Institute of Radio Engineers to form the Institute of Electrical and Electronic Engineers.
Watts S. Humphrey, born 1927, was known as the “father of software quality”, in the 1980s he founded a program aimed at understanding and managing the software process. The British Computer Society was founded in 1956.
Why the need for these professions? Much of it is about codification of best practice and developing trust between the public and practitioners. These fundamental characteristics of the professions are shared with the oldest professions (Medicine, Law) as well as the newest (Information Technology).
So where are we today? My best guess is we are somewhere equivalent to the 1980s for Software Engineering. In terms of professional deployment we have a basic understanding of the equivalent of “programming” but much less understanding of machine learning systems design and data infrastructure. How the components we have developed interoperate together in a reliable and accountable manner. Best practice is still evolving, but perhaps isn’t being shared widely enough.
One problem is that the art of data science is superficially similar to regular software engineering. Although in practice it is rather different. Modern software engineering practice operates to generate code which is well tested as it is written, agile programming techniques provide the appropriate degree of flexibility for the individual programmers alongside sufficient formalization and testing. These techniques have evolved from an overly restrictive formalization that was proposed in the early days of software engineering.
While data science involves programming, it is different in the following way. Most of the work in data science involves understanding the data and the appropriate manipulations to apply to extract knowledge from the data. The eventual number of lines of code that are required to extract that knowledge are often very few, but the amount of thought and attention that needs to be applied to each line is much more than a traditional line of software code. Testing of those lines is also of a different nature, provisions have to be made for evolving data environments. Any development work is often done on a static snapshot of data, but deployment is made in a live environment where the nature of data changes. Quality control involves checking for degradation in performance arising form unanticipated changes in data quality. It may also need to check for regulatory conformity. For example, in the UK the General Data Protection Regulation stipulates standards of explainability and fairness that may need to be monitored. These concerns do not affect traditional software deployments.
Others are also pointing out these challenges, this post from Andrej Karpathy (now head of AI at Tesla) covers the notion of “Software 2.0”. Google researchers have highlighted the challenges of “Technical Debt” in machine learning (Sculley et al., 2015). Researchers at Berkeley have characterized the systems challenges associated with machine learning (Stoica et al., 2017).
Data as a Convener
To improve communication, we need to ‘externalise cognition’: have objects that are outside our brains, are persistent in the real world, that we can combine with our individual knowledge. Doing otherwise leaves us imagining the world as our personal domain-utopias, ignoring the ugly realities of the way things actual progress.
Data can provide an excellent convener, because even if it doesn’t exist it allows conversations to occur about what data should or could exist and how it might allow us to address the questions of importance.
Models, while also of great potential value in externalising cognition, can be two complex to have conversations about and they can entrench beliefs, triggering model induced blindness (a variation on Kahneman’s theory induced blindness (Kahneman, 2011)).
Figure: Models can also be used to externalise cognition, but if the model is highly complex it’s difficult for two individuals to understand each others’ models. This shuts down conversation, often “mathematical intimidation” is used to shut down a line of questioning. This is highly destructive of the necessary cognitive diversity.
Bandwidth constraints on individuals mean that they tend to focus on their own specialism. This can be particularly problematic for those on the more theoretical side, because mathematical models are complex, and require a lot of deep thought. However, when communicating with others, unless they have the same in depth experience of mathematical modelling as the theoreticians, the models do not bring about good information coherence. Indeed, many computational models themselves are so complex now that no individual can understand the model whole.
Figure: Data can be queried, but the simplest query, what data do we need? Doesn’t even require the data to exist. It seems data can be highly effective for convening a multidisciplinary conversation.
Fritz Heider referred to happenings that are “psychologically represented in each of the participants” (Heider, 1958) as a prerequisite for conversation. Data is a route to that psychological representation.
Note: my introduction to Fritz Heider was through a talk by Nick Chater in 2010, you can read Nick’s thoughts on these issues in his book, The Mind is Flat (Chater, 2019).
Delve
Delve Reports
- Facemasks 4th May 2020 (The DELVE Initiative, 2020b)
- Test, Trace, Isolate 27th May 2020 (The DELVE Initiative, 2020c)
- Nosocomial Infections 6th July 2020 (The DELVE Initiative, 2020d)
- Schools 24th July 2020 (The DELVE Initiative, 2020e)
- Economics 14th August 2020 (The DELVE Initiative, 2020f)
- Vaccines 1st October 2020 (The DELVE Initiative, 2020g)
- Data 24th November 2020 (The DELVE Initiative, 2020a)
There is lots of hope for the role data science and AI could play, but we’re still a way off from being AI-ready. Further attention is needed on some of the foundational issues around data use – access, skills, culture – before we can begin to talk in earnest about deploying AI. [link here to data readiness]
Delve Data Report
The DELVE Initiative was established with the ambition that data science could play a role in helping develop policy responses to the COVID-19 pandemic, by identifying lessons from the responses of other countries or by combining datasets to generate novel insights. Such analysis requires access to data, which could come from both official statistics, or from so-called happenstance data, generated as a by-product of daily activities. Drawing from a multidisciplinary team of domain experts in policy, public health, economics, education, immunology, epidemiology, and social science, alongside statisticians, mathematicians, computer scientists and machine learning scientists, DELVE set out to provide advice and analysis that could feed into live policy decisions.
Our report focusses on what more we can do to ensure that this data is readily available (The DELVE Initiative, 2020a).
Delve Data Report: Recommendations
Government should update the statutory objective of the Office for National Statistics (ONS) to accommodate trustworthy access to happenstance data to generate national and local statistics. Such statistics are required on very short time frames to facilitate fast decision-making for the nation in the rapidly evolving circumstances of a national emergency.
The ONS should collaborate closely with the Information Commissioner’s Office (ICO) to formulate a standardized qualification for data access, equivalent to a ‘data driving license’ that would demonstrate trustworthiness and ensure that qualified experts can get rapid access to different data types with the appropriate standardized ethical and legal training in place.
Government should fund interdisciplinary pathfinder data projects. These projects should require collaborations between industries, run across government departments and integrate different academic expertise. Each project should target a specific policy question. Beyond the pathfinder role, the projects will leave a legacy in the form of expertise and guidance in understanding the stages of the data-sharing pipeline. Priority areas for pathfinder projects include:
Nowcasting of economic metrics: At least one of these pathfinder projects should create a close collaboration between Cabinet Office and Treasury around nowcasting of classical economic metrics (such as GDP) from happenstance data (e.g. payments data). Efficient resourcing and strategic implementation of data sharing projects will only be possible if Treasury and Cabinet Office are aligned on plausible benefits and costs of data sharing projects.
Mobility data: Another project should drive a step-change in the use of mobility data for public policy. To achieve this, the ONS should act as the trusted body to convert happenstance data into high-frequency population mobility statistics. One pathfinder project should produce daily views of population mobility between geographic regions, aggregated from origin to destination counts from mobile phone operators.
Delivering a rapid response requires the ability to quickly convene teams from across disciplines (and often institutions) around a key question. To facilitate this, we also used ideas from blog post on open data science. to facilitate communication and understanding.