

Week 5: Data Science Challenges II
[reveal]
Abstract:
In this lecture we continue our exploration of data science challenges.
Complexity in Action
As an exercise in understanding complexity, watch the following video. You will see the basketball being bounced around, and the players moving. Your job is to count the passes of those dressed in white and ignore those of the individuals dressed in black.

Figure: Daniel Simon’s famous illusion “monkey business”. Focus on the movement of the ball distracts the viewer from seeing other aspects of the image.
In a classic study Simons and Chabris (1999) ask subjects to count the number of passes of the basketball between players on the team wearing white shirts. Fifty percent of the time, these subjects don’t notice the gorilla moving across the scene.
The phenomenon of inattentional blindness is well known, e.g in their paper Simons and Charbris quote the Hungarian neurologist, Rezsö Bálint,
It is a well-known phenomenon that we do not notice anything happening in our surroundings while being absorbed in the inspection of something; focusing our attention on a certain object may happen to such an extent that we cannot perceive other objects placed in the peripheral parts of our visual field, although the light rays they emit arrive completely at the visual sphere of the cerebral cortex.
Rezsö Bálint 1907 (translated in Husain and Stein 1988, page 91)
When we combine the complexity of the world with our relatively low bandwidth for information, problems can arise. Our focus on what we perceive to be the most important problem can cause us to miss other (potentially vital) contextual information.
This phenomenon is known as selective attention or ‘inattentional blindness’.
Figure: For a longer talk on inattentional bias from Daniel Simons see this video.
Data Selective Attention Bias
We are going to see how inattention biases can play out in data analysis by going through a simple example. The analysis involves body mass index and activity information.
A Hypothesis as a Liability
This analysis is from an article titled “A Hypothesis as a Liability” (Yanai and Lercher, 2020), they start their article with the following quite from Herman Hesse.
“ ‘When someone seeks,’ said Siddhartha, ‘then it easily happens that his eyes see only the thing that he seeks, and he is able to find nothing, to take in nothing. […] Seeking means: having a goal. But finding means: being free, being open, having no goal.’ ”
Hermann Hesse
Their idea is that having a hypothesis can constrain our thinking. However, in answer to their paper Felin et al. (2021) argue that some form of hypothesis is always necessary, suggesting that a hypothesis can be a liability
My view is captured in the introductory chapter to an edited volume on computational systems biology that I worked on with Mark Girolami, Magnus Rattray and Guido Sanguinetti.
Figure: Quote from Lawrence (2010) highlighting the importance of interaction between data and hypothesis.
Popper nicely captures the interaction between hypothesis and data by relating it to the chicken and the egg. The important thing is that these two co-evolve.
Number Theatre
Unfortunately, we don’t always have time to wait for this process to converge to an answer we can all rely on before a decision is required.
Not only can we be misled by data before a decision is made, but sometimes we can be misled by data to justify the making of a decision. David Spiegelhalter refers to the phenomenon of “Number Theatre” in a conversation with Andrew Marr from May 2020 on the presentation of data.
Figure: Professor Sir David Spiegelhalter on Andrew Marr on 10th May 2020 speaking about some of the challengers around data, data presentation, and decision making in a pandemic. David mentions number theatre at 9 minutes 10 seconds.
Data Theatre
Data Theatre exploits data inattention bias to present a particular view on events that may misrepresents through selective presentation. Statisticians are one of the few groups that are trained with a sufficient degree of data skepticism. But it can also be combatted through ensuring there are domain experts present, and that they can speak freely.
Figure: The phenomenon of number theatre or data theatre was described by David Spiegelhalter and is nicely summarized by Martin Robbins in this sub-stack article https://martinrobbins.substack.com/p/data-theatre-why-the-digital-dashboards.
The Art of Statistics
The statistician’s craft is based on humility in front of data and developing the appropriate skeptical thinking around conclusions from data. The best book I’ve seen for developing that sense is Sir David Spiegelhalter’s Art of Statistics.
Figure: The Art of Statistics by David Spiegelhalter is an excellent read on the pitfalls of data interpretation.
David’s book (Spiegelhalter, 2019) brings important examples from statistics to life in an intelligent and entertaining way. It is highly readable and gives an opportunity to fast-track towards the important skill of data-skepticism that is the mark of a professional statistician.
Societal Effects
We have already seen the effects of this changed dynamic in biology and computational biology. Improved sensorics have led to the new domains of transcriptomics, epigenomics, and ‘rich phenomics’ as well as considerably augmenting our capabilities in genomics.
Biologists have had to become data-savvy, they require a rich understanding of the available data resources and need to assimilate existing data sets in their hypothesis generation as well as their experimental design. Modern biology has become a far more quantitative science, but the quantitativeness has required new methods developed in the domains of computational biology and bioinformatics.
There is also great promise for personalized health, but in health the wide data-sharing that has underpinned success in the computational biology community is much harder to carry out.
We can expect to see these phenomena reflected in wider society. Particularly as we make use of more automated decision making based only on data. This is leading to a requirement to better understand our own subjective biases to ensure that the human to computer interface allows domain experts to assimilate data driven conclusions in a well calibrated manner. This is particularly important where medical treatments are being prescribed. It also offers potential for different kinds of medical intervention. More subtle interventions are possible when the digital environment is able to respond to users in an bespoke manner. This has particular implications for treatment of mental health conditions.
The main phenomenon we see across the board is the shift in dynamic from the direct pathway between human and data, as traditionally mediated by classical statistics, to a new flow of information via the computer. This change of dynamics gives us the modern and emerging domain of data science, where the interactions between human and data are mediated by the machine.
Challenges
The field of data science is rapidly evolving. Different practitioners from different domains have their own perspectives. We identify three broad challenges that are emerging. Challenges which have not been addressed in the traditional sub-domains of data science. The challenges have social implications but require technological advance for their solutions.
- Paradoxes of the Data Society
- Quantifying the Value of Data
- Privacy, loss of control, marginalization
You can also check this blog post on Three Data Science Challenges.
Paradoxes of Data Society

Figure: Rabbit and Pooh watch the result of Pooh’s hooshing idea to move Eeyore towards the shore.
When you are a Bear of Very Little Brain, and you Think of Things, you find sometimes that a Thing which seemed very Thingish inside you is quite different when it gets out into the open and has other people looking at it.
A.A. Milne as Winnie-the-Pooh in The House at Pooh Corner, 1928
This comment from Pooh bear comes just as he’s tried to rescue his donkey friend, Eeyore, from a river by dropping a large stone on him from a bridge. Pooh’s idea had been to create a wave to push the donkey to the shore, a process that Pooh’s rabbit friend calls “hooshing”.
Hooshing is a technique many children will have tried to retrieve a ball from a river. It can work, so Pooh’s idea wasn’t a bad one, but the challenge he faced was in its execution. Pooh aimed to the side of Eeyore, unfortunately the stone fell directly on the stuffed donkey. But where is Laplace’s demon in hooshing? Just as we can talk about Gliders and Loafers in Conway’s Game of Life, we talk about stones and donkeys in our Universe. Pooh’s prediction that he can hoosh the donkey with the stone is not based on the Theory, it comes from observing the way objects interact in the actual Universe. Pooh is like the mice in Douglas Adams’s Earth. He is observing his environment. He looks for patterns in that environment. Pooh then borrows the computation that the Universe has already done for us. He has seen similar situations before, perhaps he once used a stone to hoosh a ball. He is then generalising from these previous circumstances to suggest that he can also hoosh the donkey. Despite being a bear of little brain, like the mice on Adams’s Earth, Pooh can answer questions about his universe by observing the results of the Theory of Everything playing out around him.
The Big Data Paradox
The big data paradox is the modern phenomenon of “as we collect more data, we understand less”. It is emerging in several domains, political polling, characterization of patients for trials data, monitoring twitter for political sentiment.
I like to think of the phenomenon as relating to the notion of “can’t see the wood for the trees”. Classical statistics, with randomized controlled trials, improved society’s understanding of data. It improved our ability to monitor the forest, to consider population health, voting patterns etc. It is critically dependent on active approaches to data collection that deal with confounders. This data collection can be very expensive.
In business today, it is still the gold standard, A/B tests are used to understand the effect of an intervention on revenue or customer capture or supply chain costs.

Figure: New beech leaves growing in the Gribskov Forest in the northern part of Sealand, Denmark. Photo from wikimedia commons by Malene Thyssen, http://commons.wikimedia.org/wiki/User:Malene.
The new phenomenon is happenstance data. Data that is not actively collected with a question in mind. As a result, it can mislead us. For example, if we assume the politics of active users of twitter is reflective of the wider population’s politics, then we may be misled.
However, this happenstance data often allows us to characterise a particular individual to a high degree of accuracy. Classical statistics was all about the forest, but big data can often become about the individual tree. As a result we are misled about the situation.
The phenomenon is more dangerous, because our perception is that we are characterizing the wider scenario with ever increasing accuracy. Whereas we are just becoming distracted by detail that may or may not be pertinent to the wider situation.
This is related to our limited bandwidth as humans, and the ease with which we are distracted by detail. The data-inattention-cognitive-bias.
Breadth or Depth Paradox
The first challenge we’d like to highlight is the unusual paradoxes of the data society. It is too early to determine whether these paradoxes are fundamental or transient. Evidence for them is still somewhat anecdotal, but they seem worthy of further attention.
The Paradox of Measurement
We are now able to quantify to a greater and greater degree the actions of individuals in society, and this might lead us to believe that social science, politics, economics are becoming quantifiable. We are able to get a far richer characterization of the world around us. Paradoxically it seems that as we measure more, we understand less.
How could this be possible? It may be that the greater preponderance of data is making society itself more complex. Therefore traditional approaches to measurement (e.g. polling by random sub sampling) are becoming harder, for example due to more complex batch effects, a greater stratification of society where it is more difficult to weigh the various sub-populations correctly.
The end result is that we have a Curate’s egg of a society: it is only ‘measured in parts’. Whether by examination of social media or through polling we no longer obtain the overall picture that can be necessary to obtain the depth of understanding we require.
One example of this phenomenon is the 2015 UK election which polls had as a tie and yet in practice was won by the Conservative party with a seven point advantage. A post-election poll which was truly randomized suggested that this lead was measurable, but pre-election polls are conducted on line and via phone. These approaches can under represent certain sectors. The challenge is that the truly randomized poll is expensive and time consuming. In practice on line and phone polls are usually weighted to reflect the fact that they are not truly randomized, but in a rapidly evolving society the correct weights may move faster than they can be tracked.
Another example is clinical trials. Once again they are the preserve of randomized studies to verify the efficacy of the drug. But now, rather than population becoming more stratified, it is the more personalized nature of the drugs we wish to test. A targeted drug which has efficacy in a sub-population may be harder to test due to difficulty in recruiting the sub-population, the benefit of the drug is also for a smaller sub-group, so expense of drug trials increases.
There are other less clear cut manifestations of this phenomenon. We seem to rely increasingly on social media as a news source, or as a indicator of opinion on a particular subject. But it is beholden to the whims of a vocal minority.
Similar to the way we required more paper when we first developed the computer, the solution is more classical statistics. We need to do more work to verify the tentative conclusions we produce so that we know that our new methodologies are effective.
As we increase the amount of data we acquire, we seem to be able to get better at characterizing the actions of individuals, predicting how they will behave. But we seem, somehow, to be becoming less capable at understanding society. Somehow it seems that as we measure more, we understand less.
That seems counter-intuitive. But perhaps the preponderance of data is making society itself, or the way we measure society, somehow more complex. And in turn, this means that traditional approaches to measurement are failing. So when we realize we are getting better at characterising individuals, perhaps we are only measuring society in parts.
Breadth vs Depth
Classical approaches to data analysis made use of many subjects to achieve statistical power. Traditionally, we measure a few things about many people. For example cardiac disease risks can be based on a limited number of factors in many patients (such as whether the patient smokes, blood pressure, cholesterol levels etc). Because, traditionally, data matrices are stored with individuals in rows and features in columns1, we refer to this as depth of measurement. In statistics this is sometimes known as the large \(p\), small \(n\) domain because traditionally \(p\) is used to denote the number of features we know about an individual and \(n\) is used to denote the number of individuals.
The data-revolution is giving us access to far more detail about each individual, this is leading to a breadth of coverage. This characteristic first came to prominence in computational biology and genomics where we became able to record information about mutations and transcription in millions of genes. So \(p\) became very large, but due to expense of measurement, the number of patients recorded, \(n\), was relatively small. But we now see this increasingly for other domains. With an increasing number of sensors on our wrists or in our mobile phones, we are characterizing indivdiuals in unprecedented detail. This domain can also be effectively dealt with by modifying the models that are used for the data.
So we can know an individual extremely well, or we can know a population well. The saying “Can’t see the wood for the trees”, means we are distracted by the individual trees in a forest, and can’t see the wider context. This seems appropriate for what may be going on here. We are becoming distracted by the information on the individual and we can’t see the wider context of the data.
We know that a rigorous, randomized, study would characterize that forest well, but it seems we are unwilling to invest the money required to do that and the proxies we are using are no longer effective, perhaps because of shifting patterns of behaviour driven by the rapidly evolving digital world.
Further, it’s likely that we are interested in strata within our data set. Equivalent to the structure within the forest: a clearing, a transition between types of tree, a shift in the nature of the undergrowth.
Examples
Examples exhibiting this phenomenon include recent elections, which have proven difficult to predict. Including, the UK 2015 elections, the EU referendum, the US 2016 elections and the UK 2017 elections. In each case individuals may have taken actions on the back of polls that showed one thing or another but turned out to be inaccurate. Indeed, the only accurate pre-election poll for the UK 2017 election, the YouGov poll, was not a traditional poll, it contains a new type of statistical model called Multilevel Regression and Poststratification (MRP) (Gelman and Hill, 2006).
Another example is stratified medicine. If a therapy is effective only in a sub-type of a disease, then statistical power can be lost across the whole population, particularly when that sub-type is a minority. But characterization of that sub-type is difficult. For example, new cancer immunotherapy treatments can have a dramatic effect, leading to almost total elimination of the cancer in some patients, but characterizing this sub-population is hard. This also makes it hard to develop clinical trials that prove the efficacy of the drugs.
A final example is our measurement of our economy, which increasingly may not capture where value is being generated. This is characterized by the changing nature of work, and the way individuals contribute towards society. For example, the open source community has driven the backbone of the majority of operating system software we use today, as well as cloud compute. But this value is difficult to measure as it was contributed by volunteers, not by a traditional corporate structure. Data itself may be driving this change, because the value of data accumulates in a similar way to the value of capital. The movement of data in the economy, and the value it generates is also hard to measure, and it seems there may be a large class of “have nots”, in terms of those industries whose productivity has suffered relative to the top performers. The so-called productivity gap may not just be due to skills and infrastructure, but also due to data-skills and data-infrastructure.
Challenges
The nature of the digital society has a closed loop feedback on itself. This is characterized by social media memes, which focus attention on particular issues very quickly. A good example being the photograph of Aylan Kurdi, the young Syrian boy found drowned on a Turkish beach. This photograph had a dramatic effect on attitudes towards immigration, more than the statistics that were showing that thousands were dieing in the Mediterranean each month (see this report by the University of Sheffield’s Social Media Lab). Similarly, the changed dynamics of our social circles. Filter bubbles, where our searches and/or newsfeed has been personalized to things that algorithms already know we like. Echo chambers, where we interact mainly with people we agree with and our opinions aren’t challenged. Each of these is changing the dynamic of society, and yet there is a strong temptation to use digital media for surveying information.
Solutions
The solutions to these challenges come in three flavours. Firstly, there is a need for more data. In particular data that is actively acquired to cover the gaps in our knowledge. We also need more use of classical statistical techniques, and a wider understanding of what they involve. This situation reminds me somewhat of the idea of the ‘paperless office’. The innovative research at Xerox PARC that brought us the Graphical User Interface, so prevalent today, was driven by the realization, in the 1970s that eventually offices would stop using paper. Xerox focussed research on what that office would look like as it was a perceived threat to their business. The paperless office may still come, but in practice computers brought about a significant increase in the need for paper due to the additional amounts of information that they caused to be summarized or generated. In a similar way, the world of big data is driving a need for more experimental design and more classical statistics. Any perception of the automated computer algorithm that drives all before it is at least as far away as the paperless office was in the 1970s.
We also need a better social, cognitive and biological understanding of humans and how we and our social structures respond to these interventions. Over time some of the measurables will likely stabilize, but it is not yet clear which ones.
Big Model Paradox
The big data paradox has a sister: the big model paradox. As we build more and more complex models, we start believing that we have a high-fidelity representation of reality. But the complexity of reality is way beyond our feeble imaginings. So we end up with a highly complex model, but one that falls well short in terms of reflecting reality. The complexity of the model means that it moves beyond our understanding.
Increasing Need for Human Judgment
Figure: Diane Coyle’s Fitzwilliam Lecture where she emphasises as data increases, human judgment is more needed.
The domain of human judgment is increasing.
How these firms use knowledge. How do they generate ideas?
Data as a Convener
To improve communication, we need to ‘externalise cognition’: have objects that are outside our brains, are persistent in the real world, that we can combine with our individual knowledge. Doing otherwise leaves us imagining the world as our personal domain-utopias, ignoring the ugly realities of the way things actual progress.
Data can provide an excellent convener, because even if it doesn’t exist it allows conversations to occur about what data should or could exist and how it might allow us to address the questions of importance.
Models, while also of great potential value in externalising cognition, can be two complex to have conversations about and they can entrench beliefs, triggering model induced blindness (a variation on Kahneman’s theory induced blindness (Kahneman, 2011)).
Figure: Models can also be used to externalise cognition, but if the model is highly complex it’s difficult for two individuals to understand each others’ models. This shuts down conversation, often “mathematical intimidation” is used to shut down a line of questioning. This is highly destructive of the necessary cognitive diversity.
Bandwidth constraints on individuals mean that they tend to focus on their own specialism. This can be particularly problematic for those on the more theoretical side, because mathematical models are complex, and require a lot of deep thought. However, when communicating with others, unless they have the same in depth experience of mathematical modelling as the theoreticians, the models do not bring about good information coherence. Indeed, many computational models themselves are so complex now that no individual can understand the model whole.
Figure: Data can be queried, but the simplest query, what data do we need? Doesn’t even require the data to exist. It seems data can be highly effective for convening a multidisciplinary conversation.
Fritz Heider referred to happenings that are “psychologically represented in each of the participants” (Heider, 1958) as a prerequisite for conversation. Data is a route to that psychological representation.
Note: my introduction to Fritz Heider was through a talk by Nick Chater in 2010, you can read Nick’s thoughts on these issues in his book, The Mind is Flat (Chater, 2019).
Quantifying the Value of Data
The situation is reminiscent of a thirsty castaway, set adrift. There is a sea of data, but it is not fit to drink. We need some form of data desalination before it can be consumed. But like real desalination, this is a non-trivial process, particularly if we want to achieve it at scale.
There’s a sea of data, but most of it is undrinkable.

Figure: The abundance of uncurated data is reminiscent of the abundance of undrinkable water for those cast adrift at sea.
We require data-desalination before it can be consumed!
I spoke about the challenges in data science at the NIPS 2016 Workshop on Machine Learning for Health. NIPS mainly focuses on machine learning methodologies, and many of the speakers were doing so. But before my talk, I listened to some of the other speakers talk about the challenges they had with data preparation.
- 90% of our time is spent on validation and integration (Leo Anthony Celi)
- “The Dirty Work We Don’t Want to Think About” (Eric Xing)
- “Voodoo to get it decompressed” (Francisco Giminez)
A further challenge in healthcare is that the data is collected by clinicians, often at great inconvenience to both themselves and the patient, but the control of the data is sometimes used to steer the direction of research.
The fact that we put so much effort into processing the data, but so little into allocating credit for this work is a major challenge for realizing the benefit in the data we have.
This type of work is somewhat thankless, with the exception of the clinicians’ control of the data, which probably takes things too far, those that collate and correct data sets gain little credit. In the domain of reinforcement learning the aim is to take a series of actions to achieve a stated goal and gain a reward. The credit assignment problem is the challenge in the learning algorithm of distributing credit to each of the actions which brought about the reward. We also experience this problem in society, we use proxies such as monetary reward to incentivise intermediate steps in our economy. Modern society functions because we agree to make basic expenditure on infrastructure, such as roads, which we all make use of. Our data-society is not sufficiently mature to be correctly crediting and rewarding those that undertake this work.
This situation is no better in industry than in academia. Many companies have been persuaded to accumulate all their data centrally in a so-called “data lake”. This attractive idea is problematic, because data is added to the “lake” without thought to its quality. As a result, a better name for these resources would be data swamps. Because the quality of data in them is often dubious. Data scientists when working with these sources often need to develop their own processes for checking the quality of the data before it is used. Unfortunately, the quality improvements they make are rarely fed back into the ecosystem, meaning the same purification work needs to be done repeatedly.
We need to properly incentivize the sharing and production of clean data sets, we need to correctly quantify the value in the contribution of each actor, otherwise there won’t be enough clean data to satiate the thirst of our decision-making processes.
Figure: Partially observable Markov decision process observing reward as actions are taken in different states
The value of shared data infrastructures in computational biology was recognized by the 2010 joint statement from the Wellcome Trust and other funders of research at the “Foggy Bottom” meeting. They recognised three key benefits to sharing of health data:
- faster progress in improving health
- better value for money
- higher quality science
But incentivising sharing requires incentivising collection and collation of data, and the associated credit allocation models.
Data Readiness Levels
Data Readiness Levels
Data Readiness Levels (Lawrence, 2017) are an attempt to develop a language around data quality that can bridge the gap between technical solutions and decision makers such as managers and project planners. They are inspired by Technology Readiness Levels which attempt to quantify the readiness of technologies for deployment.
See this blog post on Data Readiness Levels.
Three Grades of Data Readiness
Data-readiness describes, at its coarsest level, three separate stages of data graduation.
- Grade C - accessibility
- Transition: data becomes electronically available
- Grade B - validity
- Transition: pose a question to the data.
- Grade A - usability
The important definitions are at the transition. The move from Grade C data to Grade B data is delimited by the electronic availability of the data. The move from Grade B to Grade A data is delimited by posing a question or task to the data (Lawrence, 2017).
Accessibility: Grade C
The first grade refers to the accessibility of data. Most data science practitioners will be used to working with data-providers who, perhaps having had little experience of data-science before, state that they “have the data”. More often than not, they have not verified this. A convenient term for this is “Hearsay Data”, someone has heard that they have the data so they say they have it. This is the lowest grade of data readiness.
Progressing through Grade C involves ensuring that this data is accessible. Not just in terms of digital accessiblity, but also for regulatory, ethical and intellectual property reasons.
Validity: Grade B
Data transits from Grade C to Grade B once we can begin digital analysis on the computer. Once the challenges of access to the data have been resolved, we can make the data available either via API, or for direct loading into analysis software (such as Python, R, Matlab, Mathematica or SPSS). Once this has occured the data is at B4 level. Grade B involves the validity of the data. Does the data really represent what it purports to? There are challenges such as missing values, outliers, record duplication. Each of these needs to be investigated.
Grade B and C are important as if the work done in these grades is documented well, it can be reused in other projects. Reuse of this labour is key to reducing the costs of data-driven automated decision making. There is a strong overlap between the work required in this grade and the statistical field of exploratory data analysis (Tukey, 1977).
The need for Grade B emerges due to the fundamental change in the availability of data. Classically, the scientific question came first, and the data came later. This is still the approach in a randomized control trial, e.g. in A/B testing or clinical trials for drugs. Today data is being laid down by happenstance, and the question we wish to ask about the data often comes after the data has been created. The Grade B of data readiness ensures thought can be put into data quality before the question is defined. It is this work that is reusable across multiple teams. It is these processes that the team which is standing up the data must deliver.
Usability: Grade A
Once the validity of the data is determined, the data set can be considered for use in a particular task. This stage of data readiness is more akin to what machine learning scientists are used to doing in universities. Bringing an algorithm to bear on a well understood data set.
In Grade A we are concerned about the utility of the data given a particular task. Grade A may involve additional data collection (experimental design in statistics) to ensure that the task is fulfilled.
This is the stage where the data and the model are brought together, so expertise in learning algorithms and their application is key. Further ethical considerations, such as the fairness of the resulting predictions are required at this stage. At the end of this stage a prototype model is ready for deployment.
Deployment and maintenance of machine learning models in production is another important issue which Data Readiness Levels are only a part of the solution for.
Recursive Effects
To find out more, or to contribute ideas go to http://data-readiness.org
Throughout the data preparation pipeline, it is important to have close interaction between data scientists and application domain experts. Decisions on data preparation taken outside the context of application have dangerous downstream consequences. This provides an additional burden on the data scientist as they are required for each project, but it should also be seen as a learning and familiarization exercise for the domain expert. Long term, just as biologists have found it necessary to assimilate the skills of the bioinformatician to be effective in their science, most domains will also require a familiarity with the nature of data driven decision making and its application. Working closely with data-scientists on data preparation is one way to begin this sharing of best practice.
The processes involved in Grade C and B are often badly taught in courses on data science. Perhaps not due to a lack of interest in the areas, but maybe more due to a lack of access to real world examples where data quality is poor.
These stages of data science are also ridden with ambiguity. In the long term they could do with more formalization, and automation, but best practice needs to be understood by a wider community before that can happen.
Assessing the Organizations Readiness
Assessing the readiness of data for analysis is one action that can be taken, but assessing teams that need to assimilate the information in the data is the other side of the coin. With this in mind both Damon Civin and Nick Elprin have independently proposed the idea of a “Data Joel Test”. A “Joel Test” is a short questionnaire to establish the ability of a team to handle software engineering tasks. It is designed as a rough and ready capability assessment. A “Data Joel Test” is similar, but for assessing the capability of a team in performing data science.
Privacy, Loss of Control and Marginalization
Society is becoming harder to monitor, but the individual is becoming easier to monitor. Social media monitoring for ‘hate speech’ can easily be turned to monitoring of political dissent. Marketing becomes more sinister when the target of the marketing is so well understood and the digital environment of the target is so well controlled.
Marketing and Free Will
What does it mean for our free will if a computer can predict our individual behavior better than we ourselves can?
There is potential for both explicit and implicit discrimination on the basis of race, religion, sexuality or health status. All of these are prohibited under European law but can pass unawares or be implicit.
The GDPR is the General Data Protection Regulation, but a better name for it would simply be Good Data Practice Rules. It covers how to deal with discrimination which has a consequential effect on the individual. For example, entrance to university, access to loans or insurance. But the new phenomenon is dealing with a series of inconsequential decisions that taken together have a consequential effect.

Figure: A woman tends her house in a village in Uganda.
Statistics as a community is also focused on the single consequential effect of an analysis (efficacy of drugs, or distribution of Mosquito nets). Associated with happenstance data is happenstance decision making.
These algorithms behind these decisions are developed in a particular context. The so-called Silicon Valley bubble. But they are deployed across the world. To address this, a key challenge is capacity building in contexts which are remote from the Western norm.
Amelioration
Addressing challenges in privacy, loss of control and marginalization includes ensuring that the individual retains control of their own data. We accept privacy in our real loves, we need to accept it in our digital persona. This is vital for our control of persona and our ability to project ourselves.
Fairness goes hand in hand with privacy to protect the individual. Regulations like the GDPR date from a time where the main worry was consequential decision making. Today we also face problems from accumulation of inconsequential decisions leading to a resulting consequential effect.
Capacity building in different contexts, empowering domain experts to solve their own problems, is one aspect to the solution. A further proposal is the use of data trusts to reintroduce control of personal data for the individual.
Delve
Delve Reports
- Facemasks 4th May 2020 (The DELVE Initiative, 2020a)
- Test, Trace, Isolate 27th May 2020 (The DELVE Initiative, 2020b)
- Nosocomial Infections 6th July 2020 (The DELVE Initiative, 2020c)
- Schools 24th July 2020 (The DELVE Initiative, 2020d)
- Economics 14th August 2020 (The DELVE Initiative, 2020e)
- Vaccines 1st October 2020 (The DELVE Initiative, 2020f)
- Data 24th November 2020 (The DELVE Initiative, 2020g)
There is lots of hope for the role data science and AI could play, but we’re still a way off from being AI-ready. Further attention is needed on some of the foundational issues around data use – access, skills, culture – before we can begin to talk in earnest about deploying AI. [link here to data readiness]
Delve Data Report
The DELVE Initiative was established with the ambition that data science could play a role in helping develop policy responses to the COVID-19 pandemic, by identifying lessons from the responses of other countries or by combining datasets to generate novel insights. Such analysis requires access to data, which could come from both official statistics, or from so-called happenstance data, generated as a by-product of daily activities. Drawing from a multidisciplinary team of domain experts in policy, public health, economics, education, immunology, epidemiology, and social science, alongside statisticians, mathematicians, computer scientists and machine learning scientists, DELVE set out to provide advice and analysis that could feed into live policy decisions.
Our report focusses on what more we can do to ensure that this data is readily available (The DELVE Initiative, 2020g).
Delve Data Report: Recommendations
Government should update the statutory objective of the Office for National Statistics (ONS) to accommodate trustworthy access to happenstance data to generate national and local statistics. Such statistics are required on very short time frames to facilitate fast decision-making for the nation in the rapidly evolving circumstances of a national emergency.
The ONS should collaborate closely with the Information Commissioner’s Office (ICO) to formulate a standardized qualification for data access, equivalent to a ‘data driving license’ that would demonstrate trustworthiness and ensure that qualified experts can get rapid access to different data types with the appropriate standardized ethical and legal training in place.
Government should fund interdisciplinary pathfinder data projects. These projects should require collaborations between industries, run across government departments and integrate different academic expertise. Each project should target a specific policy question. Beyond the pathfinder role, the projects will leave a legacy in the form of expertise and guidance in understanding the stages of the data-sharing pipeline. Priority areas for pathfinder projects include:
Nowcasting of economic metrics: At least one of these pathfinder projects should create a close collaboration between Cabinet Office and Treasury around nowcasting of classical economic metrics (such as GDP) from happenstance data (e.g. payments data). Efficient resourcing and strategic implementation of data sharing projects will only be possible if Treasury and Cabinet Office are aligned on plausible benefits and costs of data sharing projects.
Mobility data: Another project should drive a step-change in the use of mobility data for public policy. To achieve this, the ONS should act as the trusted body to convert happenstance data into high-frequency population mobility statistics. One pathfinder project should produce daily views of population mobility between geographic regions, aggregated from origin to destination counts from mobile phone operators.
Delivering a rapid response requires the ability to quickly convene teams from across disciplines (and often institutions) around a key question. To facilitate this, we also used ideas from blog post on open data science. to facilitate communication and understanding.
Personal Data Trusts
The machine learning solutions we are dependent on to drive automated decision making are dependent on data. But with regard to personal data there are important issues of privacy. Data sharing brings benefits, but also exposes our digital selves. From the use of social media data for targeted advertising to influence us, to the use of genetic data to identify criminals, or natural family members. Control of our virtual selves maps on to control of our actual selves.
The feudal system that is implied by current data protection legislation has significant power asymmetries at its heart, in that the data controller has a duty of care over the data subject, but the data subject may only discover failings in that duty of care when it’s too late. Data controllers also may have conflicting motivations, and often their primary motivation is not towards the data-subject, but that is a consideration in their wider agenda.
Personal Data Trusts (Delacroix and Lawrence, 2018; Edwards, 2004; Lawrence, 2016) are a potential solution to this problem. Inspired by land societies that formed in the 19th century to bring democratic representation to the growing middle classes. A land society was a mutual organization where resources were pooled for the common good.
A Personal Data Trust would be a legal entity where the trustees’ responsibility was entirely to the members of the trust. So the motivation of the data-controllers is aligned only with the data-subjects. How data is handled would be subject to the terms under which the trust was convened. The success of an individual trust would be contingent on it satisfying its members with appropriate balancing of individual privacy with the benefits of data sharing.
Formation of Data Trusts became the number one recommendation of the Hall-Presenti report on AI, but unfortunately, the term was confounded with more general approaches to data sharing that don’t necessarily involve fiduciary responsibilities or personal data rights. It seems clear that we need to better characterize the data sharing landscape as well as propose mechanisms for tackling specific issues in data sharing.
It feels important to have a diversity of approaches, and yet it feels important that any individual trust would be large enough to be taken seriously in representing the views of its members in wider negotiations.
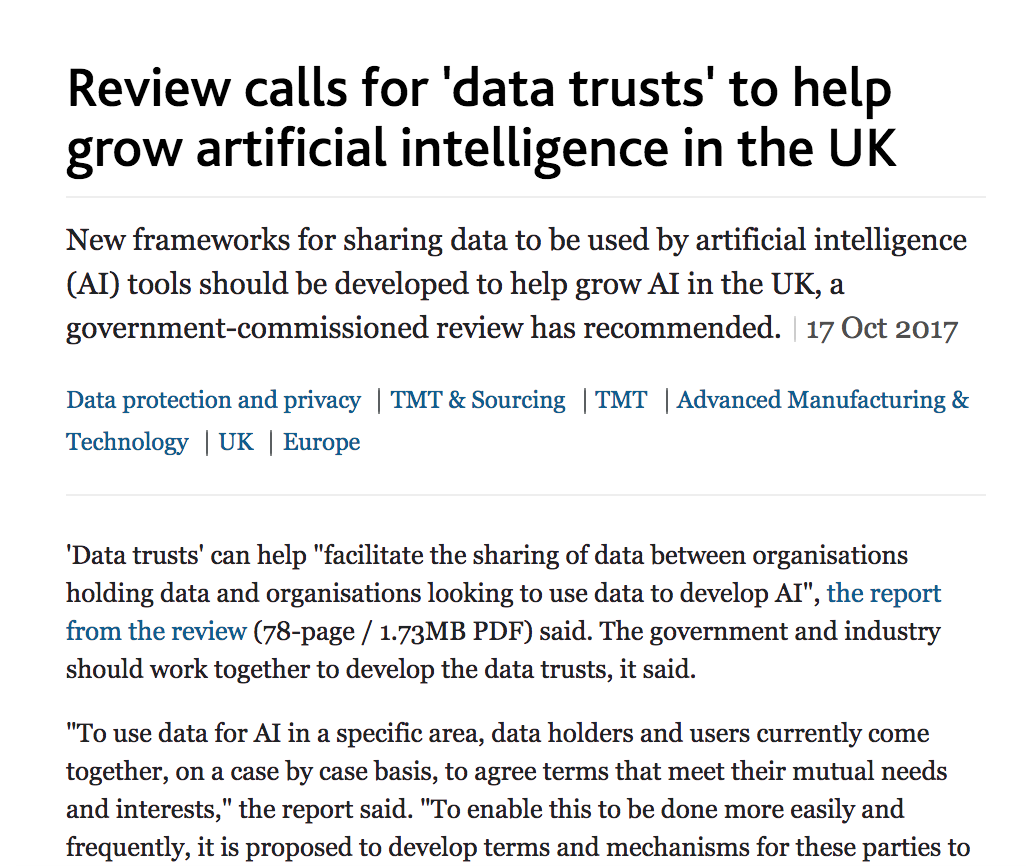
Figure: Data Trusts were the first recommendation of the Hall-Presenti Report. More recently the nature of different data intermediaries was clarified in a report on https://www.adalovelaceinstitute.org/report/legal-mechanisms-data-stewardship/ from the Ada Lovelace Institute.
See Guardian article on Digital Oligarchies and Guardian article on Information Feudalism.
Data Trusts Initiative
The Data Trusts Initiative, funded by the Patrick J. McGovern Foundation is supporting three pilot projects that consider how bottom-up empowerment can redress the imbalance associated with the digital oligarchy.
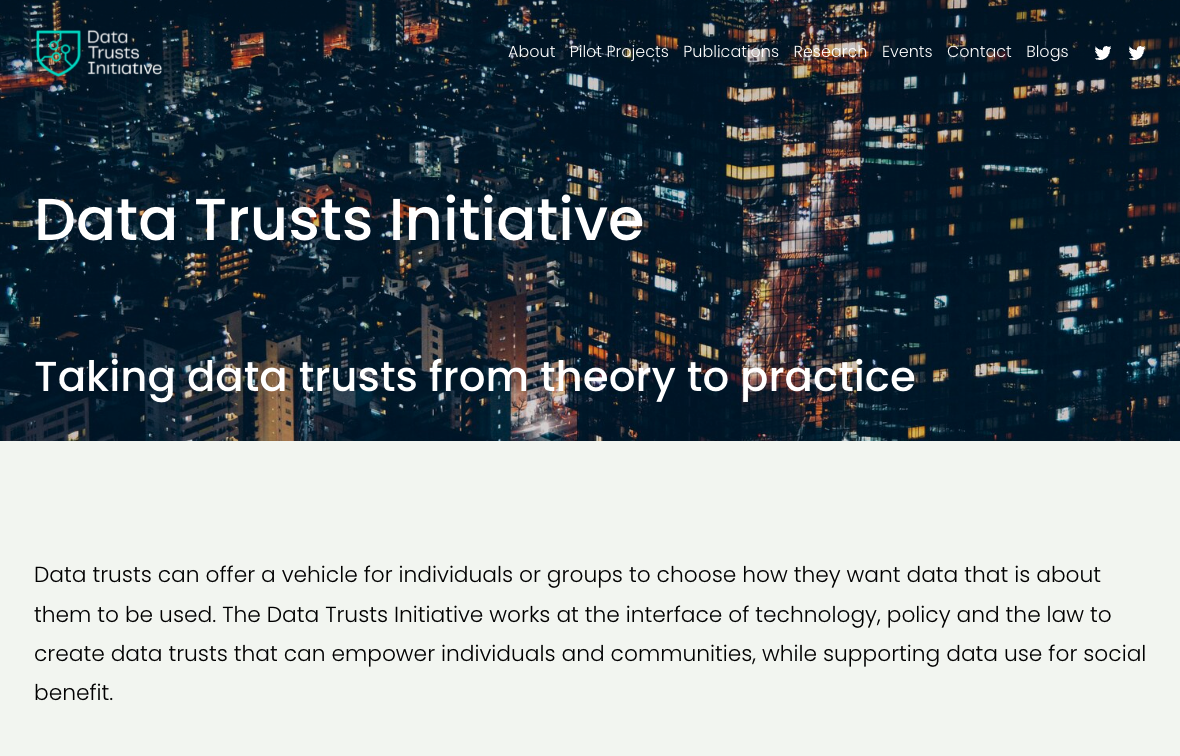
Figure: The Data Trusts Initiative (http://datatrusts.uk) hosts blog posts helping build understanding of data trusts and supports research and pilot projects.
Progress So Far
In its first 18 months of operation, the Initiative has:
Convened over 200 leading data ethics researchers and practitioners;
Funded 7 new research projects tackling knowledge gaps in data trust theory and practice;
Supported 3 real-world data trust pilot projects establishing new data stewardship mechanisms.
Data Science Africa
Figure: Data Science Africa http://datascienceafrica.org is a ground up initiative for capacity building around data science, machine learning and artificial intelligence on the African continent.
Figure: Data Science Africa meetings held up to October 2021.
Data Science Africa is a bottom up initiative for capacity building in data science, machine learning and artificial intelligence on the African continent.
As of May 2023 there have been eleven workshops and schools, located in seven different countries: Nyeri, Kenya (twice); Kampala, Uganda; Arusha, Tanzania; Abuja, Nigeria; Addis Ababa, Ethiopia; Accra, Ghana; Kampala, Uganda and Kimberley, South Africa (virtual), and in Kigali, Rwanda.
The main notion is end-to-end data science. For example, going from data collection in the farmer’s field to decision making in the Ministry of Agriculture. Or going from malaria disease counts in health centers to medicine distribution.
The philosophy is laid out in (Lawrence, 2015). The key idea is that the modern information infrastructure presents new solutions to old problems. Modes of development change because less capital investment is required to take advantage of this infrastructure. The philosophy is that local capacity building is the right way to leverage these challenges in addressing data science problems in the African context.
Data Science Africa is now a non-govermental organization registered in Kenya. The organising board of the meeting is entirely made up of scientists and academics based on the African continent.
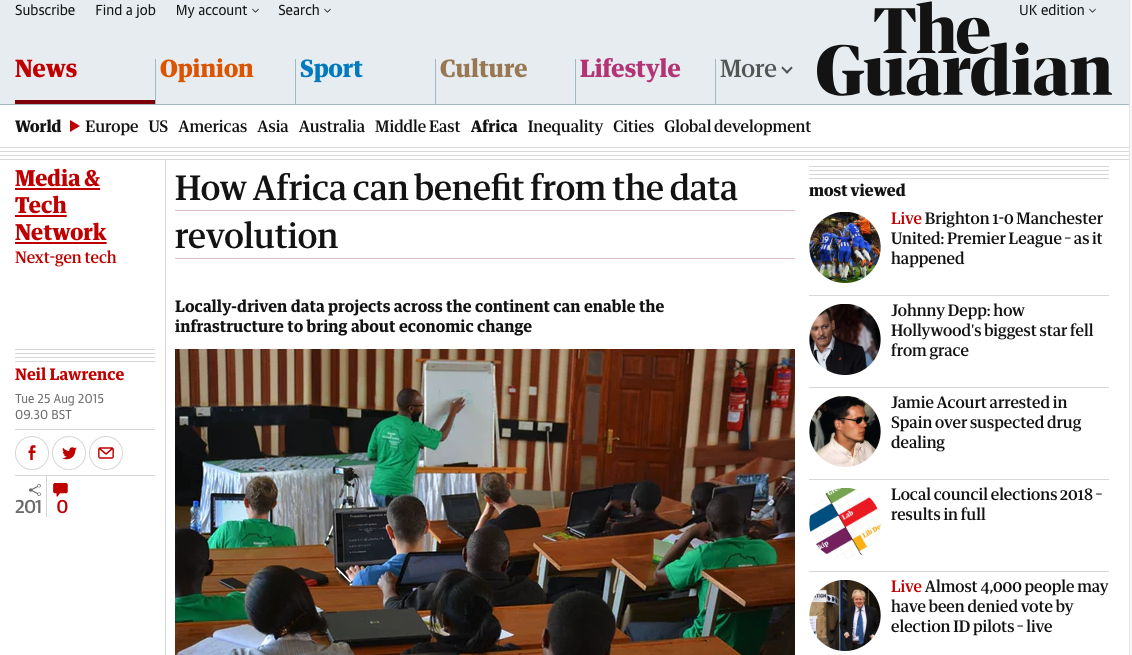
Figure: The lack of existing physical infrastructure on the African continent makes it a particularly interesting environment for deploying solutions based on the information infrastructure. The idea is explored more in this Guardian op-ed on Guardian article on How African can benefit from the data revolution.
Guardian article on Data Science Africa
We separated the challenges we face into three groups: (1) paradoxes of the odern data society, (2) quantifying the value of data and (3) privacy loss of control and marginalization. We’ve noted the origins of the paradoxes, speculating that it is based in a form of data (or modelling) inattention bias demonstrated through the Gorilla. We’ve drawn parallels between challenges of rewarding the addition of value and the credit assignment problem in reinforecement learning and we’ve looked at approaches to introduce the voice of marginalized societies and people into the conversation.
Conclusions
The particular circumstances of the Covid-19 pandemic have highlighted the challenges of integrating scientific ideas to answer policy questions. In this talk, we’ve given a formal introduction to the problem, the difficulty of communicating between individuals (particularly from different domains) and reviewed the ideas and solutions we used in the Delve initiative.
Recommendations from the DELVE Data report suggest that more effort needs to be placed into working in this manner in normal circumstances, so that when an emergency occurs we are better prepared to deal with the questions we face. Other approaches prosed include data trusts.
When we combine these difficult challenges with complex models, we need to put more effort into decomposing our models so that they may be calibrated and re-integrated at appropriate fidelities.
Thanks!
For more information on these subjects and more you might want to check the following resources.
- twitter: @lawrennd
- podcast: The Talking Machines
- newspaper: Guardian Profile Page
- blog: http://inverseprobability.com